- Demographics of Aruba
-
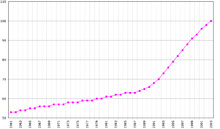
This article is about the demographic features of the population of Aruba, including population density, ethnicity, education level, health of the populace, economic status, religious affiliations and other aspects of the population.
Having poor soil and aridity, Aruba was saved from plantation economics and the slave trade. In 1515, the Spanish transported the entire population to Hispaniola to work in the copper mines; most were allowed to return when the mines were tapped out. The Dutch, who took control a century later, left the Arawaks to graze livestock, using the island as a source of meat for other Dutch possessions in the Caribbean. The Arawak heritage is stronger on Aruba than on most Caribbean islands. No full-blooded aboriginals remain, but the features of the islanders clearly indicate their genetic heritage. The majority of the population is descended mostly from Arawak, and to a lesser extent Dutch, Spanish, and African ancestors. Recently there has been substantial immigration to the island from neighboring Latin American and Caribbean nations, attracted by the lure of well-paying jobs.
The two official languages are the Dutch language and the predominant, national language Papiamento, which is classified as a creole language. This creole language is formed primarily from 16th century Portuguese, and several other languages. Spanish and English are also spoken. Islanders can often speak four or more languages and are mostly Roman Catholic.
Demographic statistics from the CIA World Factbook
 Population pyramid of Aruba
The following demographic statistics are from the CIA World Factbook, unless otherwise indicated.
Population
107,000 (July 2011 est.)
country comparison to the world: 194Age structure
- 0-14 years: 19.1% (male 9,921; female 9,758)
- 15-64 years: 70.3% (male 34,676; female 37,752)
- 65 years and over: 10.6% (male 4,531; female 6,607) (2009 est.)
Median age
- total: 37.8 years
- male: 36 years
- female: 39.5 years (2009)
Population growth rate
- 1.478% (2009 est.)
- country comparison to the world: 94
Birth rate
- 12.79 births/1,000 population (2009 est.)
- country comparison to the world: 158
Death rate
- 7.56 deaths/1,000 population (2008 est.)
- country comparison to the world: 118
Net migration rate
- 9.7 migrant(s)/1,000 population (2009 est.)
- country comparison to the world: 8
Urbanization rate
- urban population: 47% of total population (2008)
- rate of urbanization: 0.1% annual rate of change (2005-2010 est.)
Sex ratio
- at birth: 1.02 male(s)/female
- under 15 years: 1.02 male(s)/female
- 15-64 years: 0.92 male(s)/female
- 65 years and over: 0.66 male(s)/female
- total population: 0.9 male(s)/female (2009 est.)
Infant mortality rate
- total: 13.79 deaths/1,000 live births
- country comparison to the world: 132
- female: 9.22 deaths/1,000 live births
- male: 18.28 deaths/1,000 live births (2009 est.)
Life expectancy at birth
- total population: 75.28 years
- country comparison to the world: 82
- male: 72.25 years
- female: 78.38 years (2009 est.)
Total fertility rate
- 1.85 children born/woman (2009 est.)
- country comparison to the world: 149
Nationality
- by law: Dutch
- noun: Aruban(s)
- adjective: Aruban; Dutch
Religions
- Roman Catholic - 80.8%
- Evangelist - 4.1%
- Protestant - 2.5%
- Jehovah's Witness - 1.5%
- Methodist - 1.2%
- Jewish - 0.2%
- Other - 5.1%
- unspecified or unknown - 5.3 (2000 census)
Languages
- Papiamento (national language) 66.3%
- Spanish 12.6%
- English 7.7%
- Dutch (official) 5.8%
- Other 2.2%
- Unspecified or unknown 5.3% (2000 census)
Ethnic Groups
- Mixed Caribbean Amerindian and white - 80%
- Other - 20%
Literacy
- definition: n/a
- total population: 97.3%
- male: 97.5%
- female: 97.1% (2000 census)
Education expenditure
- 4.8% of total GDP (2005)
- country comparison to the world: 79
References
 This article incorporates public domain material from websites or documents of the CIA World Factbook.
Aruba topics Politics and government Coast guard · Coat of arms · Constitution · Elections · Estates (parliament) · Flag · Foreign relations · Governor · Military · Monarch · Police · Political parties · Prime Minister · Visa policyCulture and history Economy and infrastructure Geography and environment Sports See also: Index of Aruba-related articles, Outline of Aruba, Kingdom of the Netherlands, Netherlands Antilles Demographics of North America Sovereign states Antigua and Barbuda · Bahamas · Barbados · Belize · Canada · Costa Rica · Cuba · Dominica · Dominican Republic · El Salvador · Grenada · Guatemala · Haiti · Honduras · Jamaica · Mexico · Nicaragua · Panama · Saint Kitts and Nevis · Saint Lucia · Saint Vincent and the Grenadines · Trinidad and Tobago · United States
Dependencies and
other territoriesAnguilla · Aruba · Bermuda · Bonaire · British Virgin Islands · Cayman Islands · Curaçao · Greenland · Guadeloupe · Martinique · Montserrat · Puerto Rico · Saint Barthélemy · Saint Martin · Saint Pierre and Miquelon · Saba · Sint Eustatius · Sint Maarten · Turks and Caicos Islands · United States Virgin Islands
Demographics of South America Sovereign states Dependencies and
other territories- Aruba
- Bonaire
- Curaçao
- Falkland Islands
- French Guiana
- South Georgia and the South Sandwich Islands
Categories:- Aruban society
- Aruba geography stubs
Wikimedia Foundation. 2010.

