- Demographics of El Salvador
-
This article is about the demographic features of the population of El Salvador, including population density, ethnicity, education level, health of the populace, economic status, religious affiliations and other aspects of the population.
Demographics of El Salvador 
Salvadoran Children Population 6,071,774 (2011 est.)[1] Male population 3,440,918 Female population 3,625,485 Population growth 1.68% Birth rate 25.72/1,000 Death rate 5.53/1,000 Infant mortality rate 22.19/1,000 Life expectancy 73.44 years [2] Nationality Salvadoran Demographic bureaus INEC El Salvador's population numbers about 6,071,774 with 90% of Salvadorans are mixed (mixed Native American Indigenous and European Spanish origin by majority. The Salvadorans of mixed ancestry vary in their European and Native American ancestry[3] 12% of Salvadorans are white; population is mostly of Spanish, while there is also of French, German, Swiss, English, Irish, Italian, Swedish, Norwegian, Dutch and Danish descent. The majority of Central European immigrants arrived during World War II as refugees Czech Republic, Germany, Hungary, Poland, and Switzerland are scattered in different communities of El Salvador. Russians came in during the Salvadoran civil war during the cold war, to help the communist guerrillas take over the country, as did Americans, Australians, and Canadians when they helped the military government fight against the communists. About 1% is of indigenous origin (Pipil and Lenca). Very few Amerindians have retained their customs and traditions, having over time assimilated into the dominant Mestizo/Spanish culture. In the Mestizo population, Salvadorans who are racially European, especially Mediterranean, the indigenous people in El Salvador who do not speak indigenous languages or have and indigenous culture, and Salvadorans of partial Nordic race also identify themselves as Mestizo culturally.[4]
The low numbers of indigenous people may be partly explained by mass murder during the 1932 Salvadoran peasant uprising (or La Matanza) which saw (estimates of) up to 30,000 peasants killed in a short period of time (nowadays this would be considered a genocide by the army's methods to exterminate a certain racial group). Many authors note that since La Matanza the indigenous in El Salvador have been very reluctant to describe themselves as such (in census declarations for example) or to wear indigenous dress or be seen to be taking part in any cultural activities or customs that might be understood as indigenous.[5]
There is a significant population of Palestinian Christian and Chinese immigrants. There is also a small community of Jews and Muslims. Salvadorans have Middle Eastern and Arab ancestries that include Lebanon, Syria, and the majority come from Palestine that immigrated to El Salvador.
Catholicism is the majority religion in El Salvador at 57.1%.[6] Protestant groups compromise 21.2% of the population.[7] Individual groups that constitute less than 5 percent of the population include Jehovah's Witnesses 1.9%, and Mormons 0.7%.[8] A sizable 16.8% population claim no religious affiliation in El Salvador.[9]
Spanish is the language spoken by virtually all inhabitants. The capital city of San Salvador has about 1.6 million people; an estimated 37.3% of El Salvador's population live in rural areas.[10] The total impact of civil wars, dictatorships and socioeconomics drove over a million Salvadorans (both as immigrants and refugees) into the US; in addition small Salvadoran communities sprung up in Canada, Panama, Costa Rica, Europe and Australia since the migration trend began in the early 1970s.
File:Tony Saca.jpgTony Saca, last President of El Salvador 2004-2009, Saca is descended from Palestinian (Catholic Christian) immigrants who arrived in El Salvador in the early 20th century from the West Bank town of Bethlehem.Contents
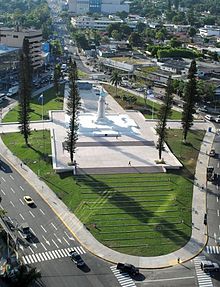
Cities and metropolitan areas
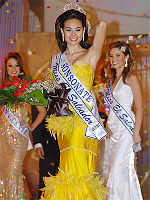
Irma Dimas is a Salvadoran model, was crowned Miss El Salvador in 2005, by Gabriela Mejía Miss El Salvador 2004 on the (right) side.
CIA World Factbook demographic statistics
}}
Ethnic groups Salvadoran women Group Number Mestizo (90%) 4,210,000 White (12%) 621,000 Native American (1%) 69,000 Source: CDI (2006) The following demographic statistics are from the CIA World Factbook, unless otherwise indicated.
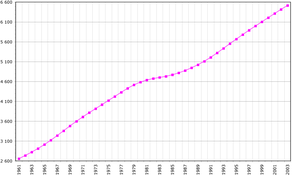
Population
- 6,071,774 (July 2011 est.)
Age structure
- 0-14 years: 35.4% (male 1,299,608/female 1,245,617)
- 15-64 years: 59.3% (male 2,033,423/female 2,225,810)
- 65 years and over: 5.3% (male 166,224/female 214,536) (2010 est.)
Population growth rate
- 0.318% (2011 est.)
Birth rate
- 29.02 births/1,000 population (2000 est.)
- 25.72 births/1,000 population (2008 est.)
- 18.06 births/1,000 population (2010 est.)
Death rate
- 6.27 deaths/1,000 population (2000 est.)
- 5.53 deaths/1,000 population (2008 est.)
- 5.61 deaths/1,000 population (2010 est.)
Net migration rate
- -4.0 migrant(s)/1,000 population (2000 est.)
- -3.4 migrant(s)/1,000 population (2008 est.)
- -9.1 migrant(s)/1,000 population (2010 est.)
Sex ratio
- at birth: 1.05 male(s)/female
- under 15 years: 1.04 male(s)/female
- 15-64 years: 0.91 male(s)/female
- 65 years and over: 0.78 male(s)/female
- total population: 0.95 male(s)/female (2008 est.)
Infant mortality rate
- 29.22 deaths/1,000 live births (2000 est.)
- 22.19 deaths/1,000 live births (2008 est.)
- 20.97 deaths/1,000 live births (2010 est.)
Life expectancy at birth
- total population: 73.18 years
- male: 70.16 years
- female: 76.87 years (2011 est.)
Total fertility rate
- 3.38 children born/woman (2000 est.)
- 3.04 children born/woman (2008 est.)
- 2.12 children born/woman (2010 est.)
- 2.08 children born/woman (2011 est.) (below the sub-replacement fertility threshold of 2.1)
Nationality
- noun: Salvadoran(s)
- adjective: Salvadoran
- noun: Central American(s)
- adjective: Central American
Ethnic groups
- Mestizo: 90%
- White: 12%
- Native American: >1% The very low numbers of Native indigenous people may be explained by mass murder during the 1932 Salvadoran peasant uprising (or La Matanza) which saw (estimates of) up to 30,000 peasants killed in a short period of time (nowadays this would be considered a genocide by the army's methods to exterminate a certain racial group)[11] The Native American population consists primary of Pipils and Lencas (the latter confined to the Eastern regions of the country).
Religions
- Roman Catholic: 57.1%%
- Protestant: 21.2%%
- No Affiliation: 16.8%
Languages
Spanish, English, French, Pipil.
Literacy
- definition: age 10 and over can read and write
- total population: 91.7%
- male: 92.1%
- female: 91.6% (2011 est.)
See also
- El Salvador
- Ethnic groups in Central America
- History of the Jews in El Salvador
- Religion in El Salvador
References
- ^ "Cia World Factbook 2008: El Salvador". https://www.cia.gov/library/publications/the-world-factbook/geos/es.html. Retrieved 2011-04-25.
- ^ [1]
- ^ a b CIA - The World Factbook - El Salvador
- ^ EL SALVADOR Visa Application - Tourist Visas, Business Visas, Expedited Visas - El Salvador Page
- ^ Military Rule, 1931-1979 - History - El Salvador - Central America: 1979 history, center poverty, cause condition, party pdc, soccer war
- ^ [2]
- ^ [3]
- ^ [4]
- ^ [5]
- ^ [6]
- ^ http://www.soitu.es/soitu/2008/08/09/info/1218307640_720352.html
Demographics of North America Sovereign states Antigua and Barbuda · Bahamas · Barbados · Belize · Canada · Costa Rica · Cuba · Dominica · Dominican Republic · El Salvador · Grenada · Guatemala · Haiti · Honduras · Jamaica · Mexico · Nicaragua · Panama · Saint Kitts and Nevis · Saint Lucia · Saint Vincent and the Grenadines · Trinidad and Tobago · United States
Dependencies and
other territoriesAnguilla · Aruba · Bermuda · Bonaire · British Virgin Islands · Cayman Islands · Curaçao · Greenland · Guadeloupe · Martinique · Montserrat · Puerto Rico · Saint Barthélemy · Saint Martin · Saint Pierre and Miquelon · Saba · Sint Eustatius · Sint Maarten · Turks and Caicos Islands · United States Virgin Islands
Categories:- Salvadoran society
- Demographics by country
Wikimedia Foundation. 2010.


