- IBM OpenDX
-
IBM OpenDX 
visualization of a scalar fieldPreview release Through CVS Development status Active Written in mainly C Platform Cross-platform Type Plotting License IBM Public License Website http://www.opendx.org OpenDX stands for Open Data Explorer and is IBM's scientific data visualization software. It can handle complex domains (as the mechanical gear or a human brain) along with measured or computed data. The data may be scalar (such as the concentration of a chemical agent in the brain), vector or tensor fields (like the displacement or strain tensor fields when the gear is in action) at different points of the object. The points at which data is measured don't have to be equally spaced, and not need to be homogeneously spaced. The project started in 1991 as Visualization Data Explorer.
OpenDX can do 3D visualizations and represent the measured quantities color or gray scale coded, or as vectors, streamlines and ribbons. It can make cuts in the object to have a view of the inside, and then represent the data on this cutting plane as a height coded graph. It can rotate the object to have a view of the data from any angle, and make animations of these movements.Contents
Graphical User Interface
OpenDX is based on the Motif widget toolkit on top of the X Window System. Its graphical user interface has a wide variety of interactors, both direct and indirect. Direct interactors allow the user to directly manipulate images (e.g. rotate or zoom). Indirect interactors (dials, switches, buttons, sliders) enable the user to control various aspects of her visualization. Interactors are smarter because they are data-driven. Interactors are auto-ranging and self-limiting. They examine the data and, depending on its type, will determine the minimum and maximum of the data, or create a list for an option menu based on the data. The user can even set the label of the interactor based on some aspect of the data (e.g., metadata).
 OpenDX screen shot showing the Visual Program Editor and several interactors
The data-driven concept is not simply for sliders, dials and option menus. It also applies to vector interactors. These will reconfigure themselves based on the dimensionality of the data. They will also auto-range themselves based on the maximum and minimum of each vector component.
Design
Data Explorer is a system of tools and user interfaces for visualizing data. In general terms the visualization of data can be considered a 3-stage process:
- Describing and importing data
- Processing the data through a visualization program
- Presenting the resulting image.
The principal components of OpenDX are
- Data model
- This is the set of definitions, rules, and conventions used to describe Data Explorer entities (including data fields, geometrical objects, and images).
- Data Prompter
- A user interface for describing data to be imported into Data Explorer.
- Data Browser
- A user interface for viewing a data file, determining the layout and organization of the data it contains, and transferring this information to the Data Prompter.
- Scripting Language
- A high-level language for creating visualization programs. It can also be used directly in a command mode to perform various tasks. Visual programs--i.e., the visualization programs displayed in the Visual Program Editor window as networks of module icons--are also written in the scripting language. A visual program constructed in this window by the user is translated into the same language when it is saved to disk.
- Visual Program Editor (VPE)
- A graphical user interface for creating and modifying visual programs (networks). Programs created with this editor are translated into the scripting language by Data Explorer and are stored in that form.
- Modules
- The building blocks (visualization tools) that constitute a visual program network. They can be directly accessed and manipulated in the Visual Program Editor.
- Module Builder
- A user interface for creating customized modules to be used in visual programs.
- Image Window
- An interactive window for viewing and modifying the presentation of the image produced by a visual program.
- Control Panels
- A user interface for changing the parameter values used by a visual program.
Screen shots
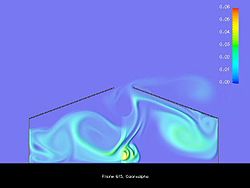
Visualization of a scalar field
 OpenDX screen-shot showing visualization of a scalar field.
In this example we show the visualization of the flow of a particulated material (dust) inside a building. In this case the quantity visualized is a scalar, namely the concentration of the particles. The concentration of particles at each point in space is represented using colors. The reader can deduce the concentration by comparing the colors with the colorbar at the right upper corner of the image. To improve the visualization the drawing is shadowed as if it had an elevation in the direction normal to the plane proportional to the concentration. In OpenDX this is called the rubber-sheet effect.
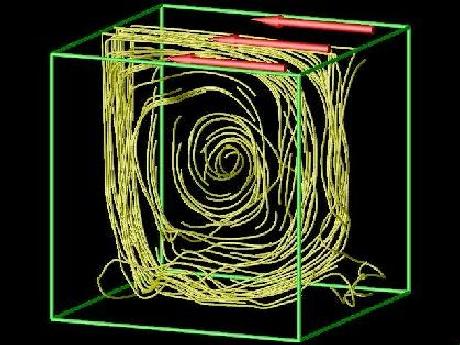
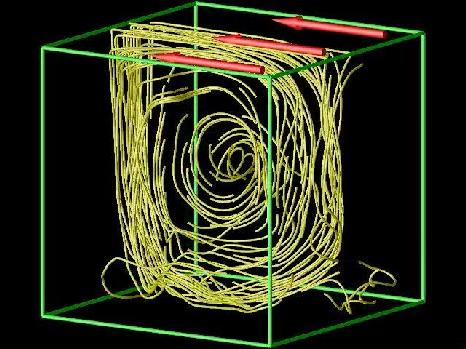
Visualization of vector fields
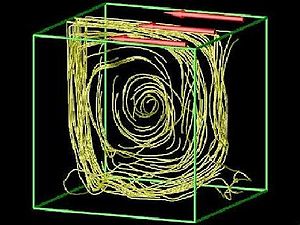
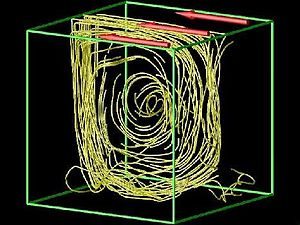
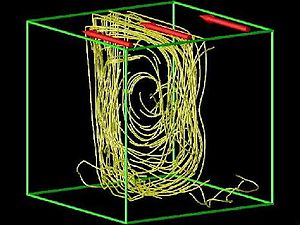
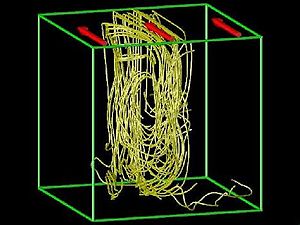
Vector fields are harder to visualize than scalar ones. Consider in this case the flow in a cubic cavity (the 3D version of the well studied square cavity benchmark. The use of streamlines helps in realizing the direction of the flow. The rockets (the big red arrows on the top of the cavity) represent the imposed flow.
External links
- http://www.opendx.org OpenDX site
- http://www.vizsolutions.com/ Commercial support, physical media
- http://www-beams.colorado.edu/dxhdf5/ module for reading HDF5 files
- http://www.featflow.de/en/index.html An opensource software developed by University of Dortmund
Categories:- Data visualization software
- IBM software
- Free software programmed in C


Wikimedia Foundation. 2010.