- Climate of Antarctica
-
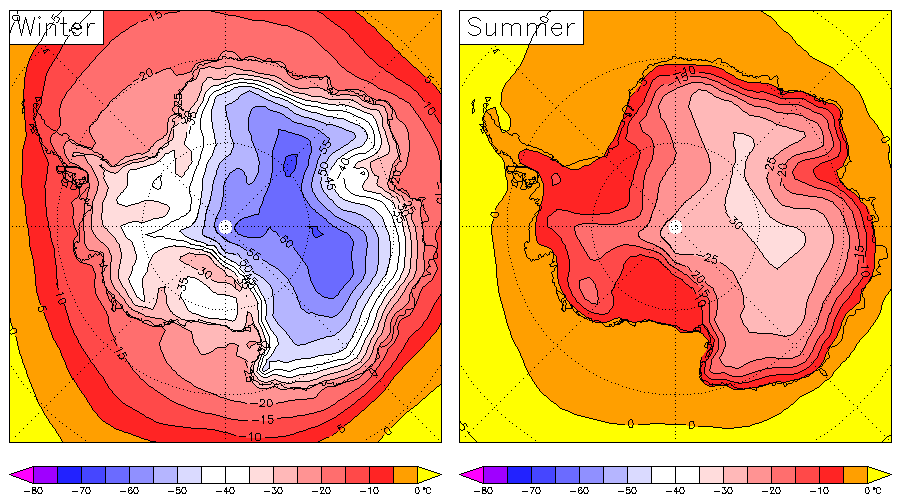
 Surface temperature of Antarctica in winter and summer
The climate of Antarctica is the coldest on the whole of Earth. Antarctica has the lowest naturally occurring temperature ever recorded on the ground on Earth: −89.2 °C (−128.6 °F) at Vostok Station.[1] It is also extremely dry (technically a desert), averaging 166 mm (6.5 in) of precipitation per year. Even so, on most parts of the continent the snow rarely melts and is eventually compressed to become the glacial ice that makes up the ice sheet. Weather fronts rarely penetrate far into the continent. Most of Antarctica has an ice cap climate (Köppen EF) with very cold, generally extremely dry weather throughout the year and no month averaging above 0 °C (32 °F). Some fringe coastal areas have a polar climate (Köppen ET) with a short summer averaging above freezing, and much higher precipitation.
Contents
Temperature
The lowest naturally occurring temperature on Earth was −89.2°C (−128.6°F); recorded on Thursday, July 21, 1983 at Vostok Station. For comparison, this is 11 °C colder than subliming dry ice. The highest temperature ever recorded in Antarctica was 14.6°C (58.3°F) in two places, Hope Bay and Vanda Station, on January 5, 1974. The mean annual temperature of the interior is −57°C (−70°F). The coast is warmer. Monthly means at McMurdo Station range from −28°C (−18.4°F) in August to −3°C (26.6°F) in January. At the South Pole, the highest temperature recorded was −14°C (7°F). Along the Antarctic Peninsula, temperatures as high as 15°C (59°F) have been recorded, though the summer temperature is usually around 2°C (36°F). Severe low temperatures vary with latitude, elevation, and distance from the ocean. East Antarctica is colder than West Antarctica because of its higher elevation. The Antarctic Peninsula has the most moderate climate. Higher temperatures occur in January along the coast and average slightly below freezing.
Precipitation
The total precipitation in Antarctica, averaged over the entire continent, is about 166 mm (6.5 in) per year (Vaughan et al., J Climate, 1999). The actual rates vary widely, from high values over the Peninsula (meters/yards per year) to very low values (as little as 50 mm (2 in) per year) in the high interior. Areas that receive less than 250 mm (10 in) of precipitation per year are classified as deserts. Almost all Antarctic precipitation falls as snow. Note that the quoted precipitation is a measure of its equivalence to water, rather than being the actual depth of snow. The air in Antarctica is also very dry. The low temperatures result in a very low absolute humidity, which means that dry skin and cracked lips are a continual problem for scientists and expeditioners working in the continent.
Weather condition classification
The weather in Antarctica can be highly variable, and the weather conditions can often change dramatically in short periods of time. There are three classifications for describing weather conditions in Antarctica. At least one of the following criteria must be met for each category.
- Condition 1
- Windspeed over 55 knots (60 miles per hour)
- Visibility less than 100 feet (30 meters)
- Wind chill below −100 °F (−73 °C)
- Description: Dangerous conditions; outside travel is not permitted.
- Condition 2
- Windspeed of 48 to 55 knots (55 to 63 miles per hour)
- Visibility 1/4 of a mile to 100 feet (402 to 30 meters)
- Wind chill of −75 °F (−60 °C) to −100 °F (−73 °C)
- Description: Unpleasant conditions; outside travel is permitted but not recommended.
- Condition 3
- Windspeed below 48 knots (55 miles per hour)
- Visibility greater than 1/4 of a mile (402 meters)
- Wind chill above −75 °F (−60 °C)
- Description: Pleasant conditions; all outside travel is permitted.
Ice cover
Nearly all of Antarctica is covered by an ice sheet that is, on average, at least 1.6 kilometres thick. Antarctica contains 90% of the world's ice and more than 70% of its fresh water. If all the land-ice covering Antarctica were to melt — around 30 million cubic kilometres of ice — the seas would rise by over 60 metres.[2] This is, however, very unlikely within the next few centuries. The Antarctic is so cold that even with increases of a few degrees, temperatures would generally remain below the melting point of ice. Warmer temperatures are expected to lead to more snow, which would increase the amount of ice in Antarctica, offsetting approximately one third of the expected sea level rise from thermal expansion of the oceans.[3] During a recent decade, East Antarctica thickened at an average rate of about 1.8 centimetres per year while West Antarctica showed an overall thinning of 0.9 centimetres per year (Davis et al., Science 2005) doi:10.1126/science.1110662. For the contribution of Antarctica to present and future sea level change, see sea level rise. Because ice flows, albeit slowly, the ice within the ice sheet is younger than the age of the sheet itself.
Morphometric data for Antarctica (from Drewry, 1983) Surface Area
(km²)Percent Mean ice thickness
(m)Volume
(km³)Percent Inland ice sheet 11,965,700 85.97 2,450 29,324,700 97.39 Ice shelves 1,541,710 11.08 475 731,900 2.43 Ice rises 78,970 .57 670 53,100 .18 Glacier ice (total) 13,586,380 2,160 30,109,800¹ Rock outcrop 331,690 2.38 Antarctica (total) 13,918,070 100.00 2,160 30,109,800¹ 100.00 ¹The total ice volume is different from the sum of the component parts because individual figures have been rounded. Regional ice data (from Drewry and others, 1982; Drewry, 1983) Region Area
(km²)Mean ice
thickness
(m)Volume
(km³)East Antarctica Inland ice 9,855,570 2,630 25,920,100 Ice shelves 293,510 400 117,400 Ice rises 4,090 400 1,600 West Antarctica (excluding Antarctic Peninsula) Inland ice sheet 1,809,760 1,780 3,221,400 Ice shelves 104,860 375 39,300 Ice rises 3,550 375 1,300 Antarctic Peninsula Inland ice sheet 300,380 610 183,200 Ice shelves 144,750 300 43,400 Ice rises 1,570 300 500 Ross Ice Shelf Ice shelf 525,840 427 224,500 Ice rises 10,320 500 5,100 Filchner-Ronne Ice Shelf Ice shelf 472,760 650 307,300 Ice rises 59,440 750 44,600 Ice shelves
 Antarctic ice shelves, 1998
Most of the coastline of Antarctica is ice shelves (floating ice sheet) or ice walls (grounded ice). Melting or breakup of floating shelf ice does not affect global sea levels, and happens regularly as shelves grow. Known changes in coastline ice:
- Around the Antarctic Peninsula:
- 1936–1989: Wordie Ice Shelf significantly reduced in size.
- 1995: Prince Gustav Channel no longer blocked by ice. Last open from about 1900 years ago to 6500 years ago, probably due to warmth during the Holocene Climatic Optimum.
- Parts of the Larsen Ice Shelf broke up in recent decades.
- 1995: The Larsen A ice shelf disintegrated in January 1995.
- 2001: 3,250 km² of the Larsen B ice shelf disintegrated in February 2001. It had been gradually retreating before the breakup event.
The George VI Ice Shelf, which may be on the brink of instability,[4] has probably existed for approximately 8000 years, after melting 1500 years earlier.[5] Warm ocean currents may have been the cause of the melting.[6] The idea that it was warmer in Antarctica 10,000 years ago is supported by ice cores, though the timing is not quite right.
Climate change
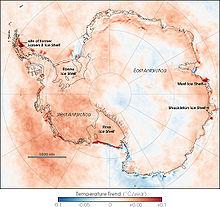 Antarctic Skin Temperature Trends between 1981 and 2007, based on thermal infrared observations made by a series of NOAA satellite sensors. Skin temperature trends do not necessarily reflect air temperature trends.
The temperature record for Antarctica goes back to the 1950s. The record consists of data from a sparse network. Four comprehensive studies were conducted in recent years,[7][8][9] collecting temperature data over Antarctica for the period since the 1950s until the 2000s. All of these studies have found slight warming in the earliest portion of the record (circa 1957–1965). Since the mid-1960s, all major studies have reported cooling over most of Antarctica. The only place that exhibits strong warming for the entire record is the Antarctic Peninsula, which amounts to 0.5% of the land mass of Antarctica.
In a paper published in the journal Nature in 2002, Doran et al. reported overall cooling over Antarctica. This study concludes there has been "a net cooling on the Antarctic continent between 1966 and 2000, particularly during summer and autumn."[7]
Chapman and Walsh, (2007) in the paper published by Journal of Climate collected temperature in and around Antarctica from 460 locations including 19 manned surface observation stations located on the continent, 73 automated weather stations, and the 2° latitude by 2° longitude gridded sea surface temperature time series. They found little change in temperature over Antarctica in last 50 years (apart from the Peninsula). From the beginning of record until about 1965 they find slight warming, since 1965 slight cooling: "Trends computed using these analyses show considerable sensitivity to start and end dates with starting dates before 1965 producing overall warming and starting dates from 1966 to 1982 producing net cooling rates over the region."[10]
Monaghan et al. (2008) in the paper published by Journal of Geophysical Research, similarly finds that "prior to 1965 the continent-wide annual trends (through 2002) are slightly positive, but after 1965 they are mainly negative (despite warming over the Antarctic Peninsula)."[9]
Steig et al. 2009 in the paper published by Nature, unlike all other major works, find significant warming trend over Antarctica 1957–2006, of 0.1 C per decade, although Steig's reconstruction agree to greater extent with other studies in showing little temperature change since late 1960s.[8]
The fact that surface melting in Antarctica maybe decreasing does not mean that Antarctica is not losing ice due to global warming. Gravity data collected from space using NASA's Grace satellite show that Antarctica has been losing more than a hundred cubic kilometers (24 cubic miles) of ice each year since 2002. The latest data reveal that Antarctica is losing ice at an accelerating rate, too. It is possible for surface melting to decrease, but for the continent to lose mass due to the fact that ice can flow without melting. [11]
A recent result from the NASA/German Aerospace Center's Gravity Recovery and Climate Experiment (Grace) suggests that since 2006 there has been more ice loss from East Antarctica than previously thought. [11]
The British Antarctic Survey, which has undertaken the majority of Britain's scientific research in the area, has the following positions: [12]
- Ice makes polar climate sensitive by introducing a strong positive feedback loop.
- Melting of continental Antarctic ice could contribute to global sea level rise.
- Climate models predict more snowfall than ice melting during the next 50 years, but models are not good enough for them to be confident about the prediction.
- Antarctica seems to be both warming around the edges and cooling at the center at the same time. Thus it is not possible to say whether it is warming or cooling overall.
- There is no evidence for a decline in overall Antarctic sea ice extent.
- The central and southern parts of the west coast of the Antarctic Peninsula have warmed by nearly 3°C. The cause is not known.
- Changes have occurred in the upper atmosphere over Antarctica.
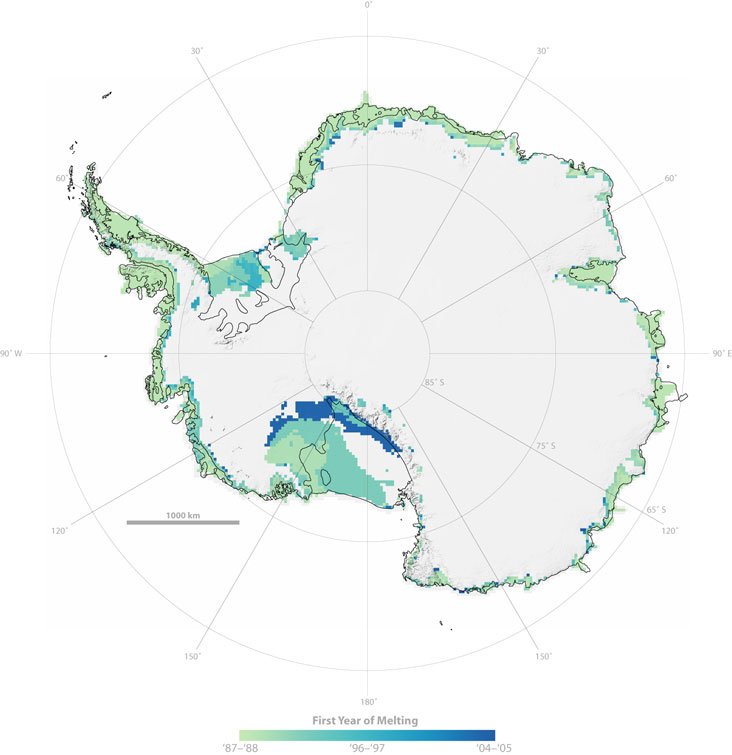
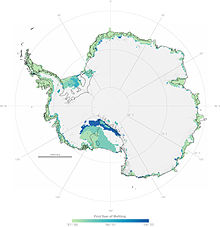 NASA map showing snowmelt in areas where it has not previously been observed
The area of strongest cooling appears at the South Pole, and the region of strongest warming lies along the Antarctic Peninsula. A possible explanation is that loss of UV-absorbing ozone may have cooled the stratosphere and strengthened the polar vortex, a pattern of spinning winds around the South Pole. The vortex acts like an atmospheric barrier, preventing warmer, coastal air from moving in to the continent's interior. A stronger polar vortex might explain the cooling trend in the interior of Antarctica. [13]
In their latest study (September 20, 2007) NASA researchers have confirmed that Antarctic snow is melting farther inland from the coast over time, melting at higher altitudes than ever and increasingly melting on Antarctica's largest ice shelf.[14]
There is also evidence for widespread glacier retreat around the Antarctic Peninsula.[15] Large ice shelves, such as the Wilkins Ice Shelf, have also been shrinking in size.
See also
- Antarctica cooling controversy
- Climate of the Arctic
- Effects of global warming
- Retreat of glaciers since 1850
References
- ^ Gavin Hudson (2008-12-14). "The Coldest Inhabited Places on Earth". Eco Worldly. http://ecoworldly.com/2008/12/14/the-coldest-inhabited-places-on-earth/. Retrieved 2009-02-08.
- ^ "Climate Change 2001: The Scientific Basis". Grida.no. http://www.grida.no/climate/ipcc_tar/wg1/412.htm#tab113. Retrieved 2011-03-27.
- ^ "Climate Change 2001: The Scientific Basis". Grida.no. http://www.grida.no/climate/ipcc_tar/wg1/428.htm. Retrieved 2011-03-27.
- ^ [1][dead link]
- ^ http://igloo.gsfc.nasa.gov/wais/pastmeetings/abstracts00/Bentley2.htm
- ^ "Press Release – New Year?s Honours for British Antarctic Survey Personnel – British Antarctic Survey". Antarctica.ac.uk. 2006-01-05. http://www.antarctica.ac.uk/News_and_Information/Press_Releases/story.php?id=160. Retrieved 2011-03-27.
- ^ a b Doran, Peter T; Priscu, JC; Lyons, WB; Walsh, JE; Fountain, AG; McKnight, Diane M; Moorhead, DL; Virginia, RA et al. (31 January 2002). "Antarctic climate cooling and terrestrial ecosystem response". Nature 415 (6871): 517–20. doi:10.1038/nature710. PMID 11793010. http://www.nature.com/nature/journal/v415/n6871/abs/nature710.html.
- ^ a b Steig, E. J.; Schneider, D. P.; Rutherford, S. D.; Mann, M. E.; Comiso, J. C.; Shindell, D. T. (2009). "Warming of the Antarctic ice-sheet surface since the 1957 International Geophysical Year". Nature 457 (7228): 459–462. doi:10.1038/nature07669. PMID 19158794.
- ^ a b Monaghan, A. J; Bromwich, D. H; Chapman, W.; Comiso, J. C (2008). "Recent variability and trends of Antarctic near-surface temperature". J. Geophys. Res 113: D04105. Bibcode 2008JGRD..11304105M. doi:10.1029/2007JD009094. http://www.agu.org/pubs/crossref/2008/2007JD009094.shtml.
- ^ Chapman, WL; Walsh, JE (2007). "A synthesis of Antarctic temperatures". J. Climate 20 (16): 4096–117. doi:10.1175/JCLI4236.1.
- ^ a b "NASA – Is Antarctica Melting?". Earthobservatory.nasa.gov. 2010. http://www.nasa.gov/topics/earth/features/0108_Is_Antarctica_Melting.html. Retrieved 2011-06-10.
- ^ "Climate Change – British Antarctic Survey". Antarctica.ac.uk. 2010-11-09. http://www.antarctica.ac.uk/Key_Topics/Climate_Change/Climate_Change_Position.html. Retrieved 2011-03-27.
- ^ "Antarctic Temperature Trend 1982–2004 : Image of the Day". Earthobservatory.nasa.gov. http://earthobservatory.nasa.gov/Newsroom/NewImages/images.php3?img_id=17257. Retrieved 2011-03-27.
- ^ "NASA Researchers Find Snowmelt in Antarctica Creeping Inland" September 20, 2007
- ^ IPCC 2007, Intergovernmental Panel on Climate Change, Climate Change 2007: The Physical Science Basis. Contribution of Working Group I to the Fourth Assessment Report of the Intergovernmental Panel on Climate Change, Cambridge University Press, 2007, page 376.
- D. G. Vaughan, G. J. Marshall, W. M. Connolley, J. C. King, and R. M. Mulvaney (2001). "Devil in the detail". Science 293 (5536): 1777–9. doi:10.1126/Science.1065116. PMID 11546858.
- M.J. Bentley, D.A. Hodgson, D.E. Sugden, S.J. Roberts, J.A. Smith, M.J. Leng, C. Bryant (2005). "Early Holocene retreat of the George VI Ice Shelf, Antarctic Peninsula". Geology 33 (3): 173–6. doi:10.1130/G21203.1.
External links
Climate
- Climate data from Antarctic surface stations with trends
- Temperature data from the READER project
- A pamphlet about the weather and climate of Antarctica
- Information concerning recent ice shelf calving
- (unreliable) maps of snowfall and temperature
- Temperature statistics at the Amundsen-Scott station on the South Pole
- Warmer temperatures, more snow...
- Antarctica's central ice cap grows while glaciers melt
- "AWS and AMRC Real-Time Weather Observations and Data". University of Wisconsin-Madison's Antarctic Weather Stations Project and Antarctic Meteorological Research Center. http://amrc.ssec.wisc.edu/realtime.html. Retrieved May 31, 2005.
- [2]
Climate change in Antarctica
- http://www.antarctica.ac.uk/Key_Topics/Climate_Change/Climate_Change_Position.html
- http://www.antarctica.ac.uk/Key_Topics/IceSheet_SeaLevel/ice_shelf_loss.html
Antarctic ice
- "Sea Ice Index – Trends in extent – Southern Hemisphere (Antarctic)". National Snow and Ice Data Center. http://www.nsidc.org/data/seaice_index/. Retrieved Jan 09 2009.
- "Coastal-Change and Glaciological Maps of Antarctica". USGS Fact Sheet 2005–3055. http://pubs.usgs.gov/fs/2005/3055/. Retrieved May 31, 2005.
- "Coastal-Change and Glaciological Maps of Antarctica". USGS Fact Sheet 050–98. http://pubs.usgs.gov/fs/fs50-98/. Retrieved February 28, 2005.
- "Coastal-change and glaciological map of the Eights Coast area, Antarctica; 1972–2001". U.S. Geological Survey Scientific Investigations Series Map, I-2600-E. http://pubs.usgs.gov/imap/2600/E. Retrieved February 28, 2005.
- "Coastal-change and glaciological map of the Bakutis Coast area, Antarctica; 1972–2002". U.S. Geological Survey Scientific Investigations Series Map, I-2600-F. http://pubs.usgs.gov/imap/2600/F. Retrieved February 28, 2005.
- "Coastal-change and glaciological map of the Saunders Coast area, Antarctica; 1972–1997". U.S. Geological Survey Scientific Investigations Series Map, I-2600-G. http://pubs.usgs.gov/imap/2600/G. Retrieved February 28, 2005.
- "Satellite Image Atlas of Glaciers of the World – Antarctica". U.S. Geological Survey Professional Paper 1386-B. http://pubs.usgs.gov/prof/p1386b/. Retrieved February 28, 2005.
Antarctica Main articles - Antarctic
- History
- Geography
- Climate
- Expeditions
- Research stations
- Field camps
- Territorial claims
- Antarctic Treaty System
- Telecommunications
- Demographics
- Economy
- Tourism
- Transport
- Military activity in the Antarctic
Geographic regions - Antarctic Peninsula
- East Antarctica
- West Antarctica
- Extreme points of the Antarctic
- List of Antarctic and subantarctic islands
- Antarctica ecozone
Waterways Famous explorers Categories:- Environment of Antarctica
- Climate
- Climate change


Wikimedia Foundation. 2010.