- Solar power in the European Union
-
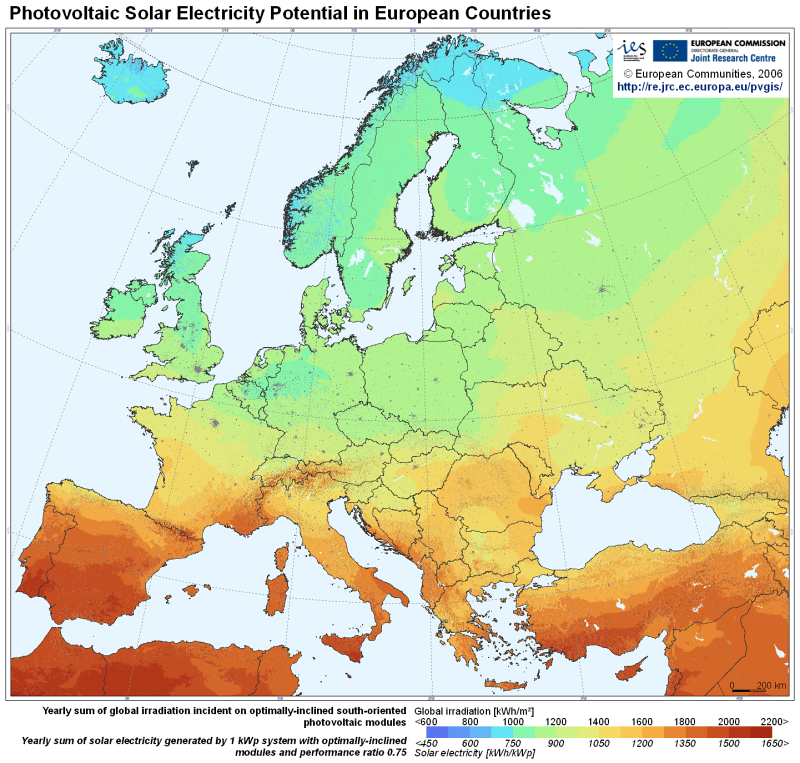
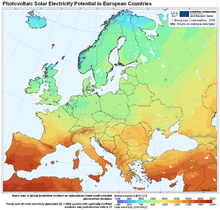 Map of solar electricity potential in Europe
Solar power in the European Union
Solar power consists of photovoltaic and solar thermal power.
During 2010, the European solar heating yield was 17.3 TWh, annual turnover 2.6 Billion € and employment 33,500 persons (1 job for 80 kW new capacity). Turnover is concentrated in local small and medium businesses.[1]
Contents
Photovoltaic solar power
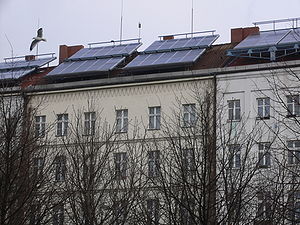 Photovoltaic cells in use on top of a building in Berlin.
PV in Europe (MWpeak)[2][3][4][5] # Country 2005 2006 2007 2008 2009 2010 1  Germany
1,910 3,063 3,846 6,019 9,959 17,370 2  Spain
Spain58 118 733 3,421 3,438 3,808 3  Italy
Italy46 58 120 458 1,157 3,478 4  Czech Republic
0 1 4 55 463 1,953 5  France
26 33 47 104 335 1,054 6  Belgium
2 4 22 71 574 787 7  Greece
5 7 9 19 55 205 8  Slovakia
0 0 0 0.07 0.2 144 9  Portugal
3 4 18 68 102 131 10  Austria
24 29 27 32 53 103 11  Netherlands
51 51 53 57 68 97 12  United Kingdom
11 14 19 23 30 75 13  Slovenia
0.2 0.4 1 2 9 36 14  Luxembourg
24 24 24 25 26 27 15  Bulgaria
0.8 1 6 17 16  Sweden
4 5 6 8 9 10 17  Finland
4 4 5 6 8 10 18  Denmark
3 3 3 3 5 7 19  Cyprus
0.5 1 1 2 3 6 20  Romania
0.2 0.3 0.5 0.6 2 21  Poland
0.3 0.4 0.6 1 1 2 22  Hungary
0.2 0.2 0.4 0.5 0.7 2 23  Malta
Malta0.1 0.1 0.1 0.2 2 2 24  Ireland
0.3 0.3 0.4 0.4 0.6 0.6 25  Lithuania
0 0 0 0.06 0.07 0.1 26  Estonia
0 0 0 0.01 0.05 0.08 27  Latvia
0 0 0 0.004 0.008 0.008 EU 27 (GWp) 2.17 3.42 4.94 10.38 15.86 29.33 PV per capita 2010[5] # Country W/capita 1 Germany212.3 2 Czech Republic185.9 3 Spain82.8 4 Belgium72.6 5 Italy57.6 6 Luxembourg54.3 7 Slovakia26.5 8 Greece18.2 9 Slovenia17.8 10 France16.3 11 Portugal12.3 12 Austria12.2 13 Cyprus7.8 14 Netherlands5.8 15 Malta4.0 16 Bulgaria2.3 17 Finland1.8 18 Denmark1.3 19 United Kingdom1.2 20 Sweden1.1 21 Hungary0.2 22 Ireland0.1 23 Romania0.1 24 Estonia0.1 25 Poland0.0 26 Lithuania0.0 27 Latvia0.0 EU27 (W/capita) 58.5 The need for the strategic development of photovoltaic systems in the EU has led to the creation of PV-NET, a network that gathers representatives from all the sectors of the research and development community concerned with the photovoltaic solar energy industry (see solar cell). The network promotes communication between speakers through the organisation of specialised conferences, workshops and congresses.
This interaction has led to the editing of a waybill, finished in 2003 with the aim of providing a solid basis for EU leaders and European citizens to base their decisions and policy making and in order to help reach the objective set by the European Commission to multiply the use of photovoltaic systems by thirty times by 2010. In 2002, the world production of photovoltaic modules surpassed 550 MW, of which more than the 50% was produced in the EU. At the end of 2004, 79% of all European capacity was in Germany, where 794 MWp had been installed.
In 2010, Spain had the largest photovoltaic power station in the world – 60 MWp Olmedilla Photovoltaic Park, which was completed in 2008. Germany is on the top of installed capacity with 17,370 MW (almost two thirds of whole EU27 capacity) and also for installed capacity per capita with 212 W.[5]
Solar thermal
Solar heating in Europe* (MWthermal)[6][7] # Country Add
2006Add
2007Add
2008Total
2008Total
2009Total
20101 Germany1,050 665 1,470 7,766 9,036 9,831 2 Austria205 197 243 2,268 3,031 3,227 3 Greece168 198 209 2,708 2,853 2,855 4 Italy130 172 295 1,124 1,410 1,753 5 Spain123 183 304 988 1,306 1,543 6 France154 179 272 1,137 1,287 1,470 7 Netherlands10 14 18 254 533 557 8 Portugal14 18 60 223 395 526 9 Cyprus42 46 48 485 490 491 10 Czech Republic15 18 25 116 362 471 11 Poland29 47 91 254 357 459 12 Denmark18 16 23 293 339 379 13 United Kingdom38 38 57 270 333 374 14 Sweden20 18 19 202 295 312 15 Belgium25 30 64 188 232 261 16 Slovenia5 8 11 96 111 116 17 Ireland4 11 31 52 85 106 18 Romania0 0 6 66 80 101 19 Slovakia6 6 9 67 73 84 20 Hungary1 6 8 18 59 71 21 Bulgaria2 2 3 22 56 62 22 Malta3 4 4 25 31 37 23 Finland2 3 3 18 20 23 24 Luxembourg2 2 3 16 14 16 25 Latvia1 1 1 5 6 7 26 Lithuania0 0 1 3 3 4 27 Estonia0 0 0 1 2 2 27 EU27 (GW) 2.10 1.93 3.33 19.08 22.80 25.14 2004–2006
The relation between collector area and rated power: 1m2 = 0.7 kW thermalOver the next 10 years the European solar thermal will grow on average at a rate of 15% per annum. According to the National Renewable Energy Action Plans the total solar thermal capacity in the EU will be 102 GW in 2020 (while 14 GW in 2006).[1]
In June 2009, the European Parliament and Council adopted the Directive on the promotion of the use of energy from Renewable Energy Sources (RES). For the first time, heating and cooling accounting for half of the final energy demand will be covered by a European directive promoting renewable energies. The overall renewable target is legally binding but renewable mix is free. According to the delivered national plans the highest of solar heating markets during 2010-2020 will be in Italy, Germany, France, Spain and Poland in respect to the national target in 2020 and capacity increase. Top countries per capita will be Cyprus, Greece, Austria, Italy and Belgium.[1]
In some European countries the solar thermal market is still in its infancy. Bulgaria, Denmark, Netherlands, Sweden, and United Kingdom have extremely low targets in their plans. Estonia, Finland, Latvia, and Romania have not included solar thermal in their national plans at all.[1]
Solar heating is the usage of solar energy to provide space or water heating. Worldwide the use was 88 GWthermal in 2005. Growth potential is enormous. The EU have been second after China in the installations. If all EU countries had used solar thermal as enthusiastically as the Austrians, the EU’s installed capacity would have been 91 GWth (130 million m2, far beyond the target of 100 million m2 by 2010, set by the White Paper in 1997. In 2005 solar heating in the EU was equivalent to more than 686,000 tons of oil. ESTIF’s minimum target is to produce solar heating equivalent to 5,600,000 tons of oil (2020). A more ambitious, but feasible, target is 73 millions tons of oil per year (2020) – a lorry row spanning 1,5 times around the globe.[8]
Solar heating
per capita 2010[7]# Country W/
capita1 Cyprus611 2 Austria385 3 Greece253 4 Germany120 5 Malta90 6 Denmark68 7 Slovenia57 8 Portugal49 9 Czech Republic45 10 Netherlands34 11 Spain34 12 Sweden33 13 Luxembourg32 14 Italy29 15 Belgium24 16 Ireland24 17 France23 18 Slovakia15 19 Poland12 20 Bulgaria8 21 Hungary7 22 United Kingdom6 23 Romania5 24 Finland4 25 Latvia3 26 Estonia1 27 Lithuania1 EU27 (W/capita) 50 Organizations
The European Photovoltaic Industry Association (EPIA) is the world's largest industry association devoted to the solar electricity market. The association aims to promote photovoltaics at the national, European and worldwide levels.[9]
EPIA organizes the International Thin Film Conference.[10]
See also
- Renewable energy in the European Union
- Daniel Lincot
- Dye-sensitized solar cell
- Photovoltaic Energy Development and Research Institute
- Desertec
References
- ^ a b c d [Solar Thermal Markets in Europe Trends and Market Statistics 2010], European Solar Thermal Industry Federation (ESTIF) June 2011 p. 14-15, Figure Capacity in operation 2010/2020
- ^ Photovoltaic energy barometer 2007 – EurObserv’ER Systèmes solaires Le journal des énergies renouvelables n° 178, p. 49-70, 4/2007
- ^ Photovoltaic energy barometer 2009 – EurObserv’ER Systèmes solaires Le journal des énergies renouvelables n° 190, p. 72-102, 3/2009
- ^ Photovoltaic energy barometer 2010 – EurObserv’ER
- ^ a b c Photovoltaic energy barometer 2011 – EurObserv’ER
- ^ Solar thermal market grows strongly in Europe Trends and Market Statistics 2008, ESTIF 5/2009
- ^ a b EurObserv'ER 203 (2011) - Solar thermal and concentrated solar power barometer
- ^ Solar Thermal Action Plan for Europe ESTIF, 1/2007
- ^ http://www.epia.org/index.php?id=4
- ^ http://www.thinfilmconference.org
External links
- European Commission:
- European Union Photovoltaic Roadmap 2002
- Sustainable Energy Europe Campaign
- European Photovoltaic Technology Platform
- European Solar Days
Renewable energy by country Wind by regionby countrySolar by regionAsia · Europe (EU)Australia · Canada · China · Germany · Greece · India · Israel · Italy · Japan · Morocco · Pakistan · Portugal · Romania · Spain · Turkey · United Kingdom · United StatesGeothermal by countryAustralia · Canada · Chile · China · Denmark · Germany · Iceland · Indonesia · Japan · Kenya · Mexico · New Zealand · Philippines · Portugal · Romania · Russia · Turkey · United Kingdom · United States · West IndiesCategories:- Solar power in the European Union
- Electric power in the European Union

Wikimedia Foundation. 2010.