- Dutch general election, 1994
-
Dutch general election, 1994 
1989 ← May 3, 1994 → 1998 All 150 seats to the House of Representatives
76 seats were needed for a majorityFirst party Second party Third party 
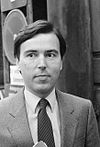
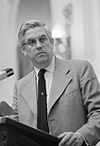
Leader Wim Kok Elco Brinkman Frits Bolkestein Party PvdA CDA VVD Leader since 1986 1994 1990 Last election 49 seats, 31,9% 54 seats, 35,3% 22 seats, 14,6% Seats won 37 34 31 Seat change -12 -20 +9 Popular vote 2.151.394 1.995.155 1.790.952 Percentage 23,9% 22,2% 19,9% Fourth party Fifth party Sixth party 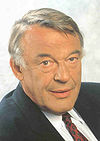


Leader Hans van Mierlo Jet Nijpels Ina Brouwer &
Mohamed RabbaeParty D66 AOV GL Leader since 1986 1994 1994 Last election 12 seats, 7,9% First Election 6 seats, 4,1% Seats won 24 6 5 Seat change +12 +6 -1 Popular vote 1.390.047 326.129 311.033 Percentage 15,4% 3,6% 3,4% Seventh party Eighth party Ninth party 


Leader Hans Janmaat Leen van Dijke Bas van der Vlies Party CD RPF SGP Leader since 1984 1994 1986 Last election 1 seats, 0,9% 1 seats, 1,0% 3 seats, 1,9% Seats won 3 3 2 Seat change +2 +2 -1 Popular vote 220,621 158,627 155,230 Percentage 2,4% 1,7% 1,7%
Seats
Prime Minister before election
Prime Minister
The General Election to the House of Representatives of the States-General of the Netherlands was held in the Netherlands on May 3, 1994.
Results
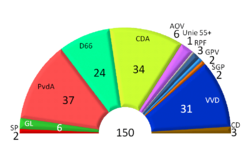
The 1994 elections led to a landslide loss for the governing coalition of PvdA and CDA. The two liberal parties, VVD and D66 profited from this. As did two parties for the elderly, AOV and Unie 55+, and the socialist SP. These three had not previously held seats.
Quite unexpected, both the green GroenLinks and the Orthodox Christian SGP lost one seat.
The formation of a government coalition was arduous but after four months the First Kok cabinet was formed. An unprecedented coalition of the Social Democrats, Progressive, and Conservative Liberals was formed keeping the Christian Democrats out of government. These had governed since 1918.
National summary
Party Lijsttrekker Votes % Seats +/- Labour Party Wim Kok 2,151,394 23.9 37 - 12 Christian Democratic Appeal Elco Brinkman 1,995,155 22.2 34 - 20 People's Party for Freedom and Democracy Frits Bolkestein 1,790,952 19.9 31 + 8 Democrats 66 Hans van Mierlo 1,390,047 15.4 24 + 12 General Elderly Alliance Jet Nijpels 326,129 3.6 6 + 6 GreenLeft Ina Brouwer & Mohamed Rabbae 311,033 3.4 5 - 1 Centre Democrats Hans Janmaat 220,621 2.4 3 + 2 Reformatory Political Federation Leen van Dijke 158,627 1,7 3 + 2 Reformed Political Party Bas van der Vlies 155,230 1,7 2 - 1 Reformed Political League Gert Schutte 119,108 1,3 2 0 Socialist Party Jan Marijnissen 118,738 1.3 2 + 2 Union 55+ Bertus Leerkes 78,079 0.8 1 + 1 Total 8,981,556 - 150 0 External Resources
- NSD: European Election Database - Netherlands publishes regional level election data (NUTS 1-3); allows for comparisons of election results, 1994-2010
Netherlands 
This article is part of the series:
Politics and government of
the NetherlandsConstitutionCabinetDecentralized gov'tForeign policyRelated subjects
 Elections and referendums in the Netherlands
General elections European elections Referendums Categories:- Elections in the Netherlands
- 1994 elections in Europe
- 1994 in the Netherlands
Wikimedia Foundation. 2010.

