- Dutch provincial elections, 2011
-
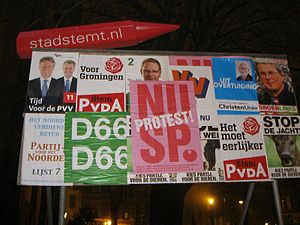 Election board in Groningen.
Netherlands 
This article is part of the series:
Politics and government of
the NetherlandsConstitutionCabinetDecentralized gov'tForeign policyRelated subjects
Provincial elections were held on the Netherlands on Wednesday 2 March 2011. Eligible voters elected the members of the States-Provincial in the twelve provinces. These elections also indirectly determined the members of the Senate, since the 566 members of the twelve States-Provincial elected the Senate's 75 members in the Senate election on 23 May 2011.
The Senate election and therefore the provincial elections are important, since the current Rutte cabinet had a minority in the Senate when it took office. The coalition and support parties hoped to gain a majority in the Senate through these elections, but failed to do so, obtaining 37 out of 75 seats. However, it is expected that the small Christian party SGP, which obtained one seat, will support the cabinet.[1]
On the same date, Island Council elections were held in the three public bodies of the Caribbean Netherlands. In the future, it is planned that the members of the Island Councils will also have a vote in the Senate election, but in 2011 this will not yet be the case because this requires a change in the Constitution.
Contents
Results
The right-liberal People's Party for Freedom and Democracy, left-liberal D66, and right-wing Party for Freedom made significant gains throughout the provinces. The Labor Party stayed relatively stable, while the Socialist Party suffered losses from their 2007 results. The Christian Democratic Appeal suffered big losses losing some 65 of their previous 151 provincial seats. However, the party didn't fare as bad as the polls suggested.
This was the first provincial elections that Geert Wilders' Party for Freedom participated in. The party managed to pick up seats in all of the Netherlands' provinces with its best results in the southern provinces of North Brabant and Limburg. In Limburg it even managed to become the biggest party by a slim margin.
National Results
States-Provincial Political Party 2007 2011 Change People's Party for Freedom and Democracy 102 112 +10 Labour Party 114 107 -7 Christian Democratic Appeal 151 86 -65 Party for Freedom 0 69 +69 Socialist Party 83 56 -27 Democrats 66 9 42 +33 Green Left 33 34 +1 Christian Union 38 24 -14 Reformed Political Party 13 12 -1 50PLUS 0 9 +9 Party for the Animals 8 7 -1 Frisian National Party 5 4 -1 Party for Zeeland 2 2 0 Senior Party NH / United Senior Party 1 1 0 Party for the North 1 1 0 Party New Limburg 1 0 -1 Beautiful Utrecht 1 0 -1 other parties 2 0 -2 Total 564 566 Turnout 46.3% 55.9% Due to population growth in Gelderland, the number of seats in the Gelderland States-Provincial increased from 53 to 55, accounting for the increase in the total number of seats from 564 to 566.
External link
- Provinciale Statenverkiezingen 2011 States-Provincial Election 2011 from NRC Handelsblad (Dutch)
References


This Dutch elections-related article is a stub. You can help Wikipedia by expanding it.

