- Data driven journalism
-
Data-driven journalism is a journalistic process based on analyzing and filtering large data sets for the purpose of creating a new story. Data-driven journalism deals with open data that is freely available online and analyzed with open source tools.[1] Data-driven journalism strives to reach new levels of service for the public, helping consumers, managers, politicians to understand patterns and make decisions based on the findings. As such, data driven journalism might help to put journalists into a role relevant for society in a new way.
Contents
Definitions
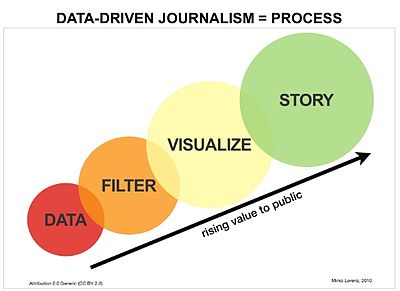 The data-driven journalism process.
According to information architect and multimedia journalist Mirko Lorenz, data-driven journalism is a workflow that consists of the following elements: digging deep into data by scraping, cleansing and structuring it, filtering by mining for specific information, visualizing and making a story.[2] This process can be extended to provide information results that cater to individual interests and the broader public.
Data journalism trainer and writer Paul Bradshaw describes the process of data-driven journalism in a similar manner: data must be found, which may require specialized skills like MySQL or Python, then interrogated, for which understanding of jargon and statistics is necessary, and finally visualized and mashed with the aid of open source tools.[3]
Reporting based on data
Telling stories based on the data is the primary goal. The findings from data can be transformed into any form of journalistic writing. Visualizations can be used to create a clear understanding of a complex situation. Furthermore, elements of storytelling can be used to illustrate what the findings actually mean, from the perspective of someone who is affected by a development. This connection between data and story can be viewed as a "new arc" trying to span the gap between developments that are relevant, but poorly understood, to a story that is verifiable, trustworthy, relevant and easy to remember.
Data-driven journalism and the value of trust
Based on the perspective of looking deeper into facts and drivers of events, there is a suggested change in media strategies: In this view the idea is to move "from attention to trust". The creation of attention, which has been a pillar of media business models has lost its relevance because reports of new events are often faster distributed via new platforms such as Twitter than through traditional media channels. On the other hand, trust can be understood as a scarce resource. While distributing information is much easier and faster via the web, the abundance of offerings creates costs to verify and check the content of any story create an opportunity. The view to transform media companies into trusted data hubs has been described in an article cross-published in February 2011 on Owni.eu[4] and Nieman Lab.[5]
Process of data-driven journalism
The process to transform raw data into stories is aking to a refinement and transformation. The main goal is to extract information recipients can act upon. The task of a data journalist is to extract what is hidden. This approach can be applied to almost any context, such as finances, health, environment or other areas of public interest.
Inverted pyramid of data journalism
In 2011, Paul Bradshaw introduced a model, he called "The Inverted Pyramid of Data Journalism".
Steps of the process
In order to achieve this, the process should be split up into several steps. While the steps leading to results can differ, a basic distinction can be made by looking at six phases:
- Find: Searching for data on the web
- Clean: Process to filter and transform data, preparation for visualization
- Visualize: Displaying the pattern, either as a static or animated visual
- Publish: Integrating the visuals, attaching data to stories
- Distribute: Enabling access on a variety of devices, such as the web, tablets and mobile
- Measure: Tracking usage of data stories over time and across the spectrum of uses.
Description of the steps
Find data
Data can be obtained directly from governmental databases such as data.gov, data.gov.uk and World Bank Data API[6] but also by placing Freedom of Information requests to government agencies; some requests are made and aggregated on websites like the UK's What Do They Know. While there is a worldwide trend towards opening data, there are national differences as to what extend that information is freely available in usable formats. If the data is in a webpage, scrapers are used to generate a spreadsheet. Examples of scrapers are: ScraperWiki, Firefox plugin OutWit Hub or Needlebase. In other cases OCR-Software can be used to get data from PDFs.
• How to analyze unfamiliar data: circle, dive, and riff[7]
Clean data
Usually data is not in a format that is easy to visualize. Examples being that there are too many data points or that the rows and columns need to be sorted differently. Another issue is that once investigated many datasets need to be cleaned, structured and transformed. Various open source tools like Google Refine, Data Wrangler and Google Spreadsheets[8] allow uploading, extracting or formatting data.
Visualize data
To visualize data in the form of graphs and charts, applications such as Many Eyes or Tableau Public are available. Yahoo! Pipes and Open Heat Map[9] are examples of tools that enable the creation of maps based on data spreadsheets. The number of options and platforms is expanding. Some new offerings provide options to search, display and embed data, an example being Timetric.[10]
To create meaningful and relevant visualizations, journalists use a growing number of tools. There are by now, several descriptions what to look for and how to do it. Most notable published articles are:
- Joel Gunter: #ijf11: Lessons in data journalism from the New York Times, published on Journalism.co.uk (April 16, 2011)[11]
- Steve Myers: Using Data Visualization as a Reporting Tool Can Reveal Story’s Shape, published on Poynter (April 10, 2009, updated March 4, 2011), including a link to a tutorial by Sarah Cohen[12]
As of 2011, the use of HTML 5 libraries using the canvas tag is gaining in popularity. There are numerous libraries enabling to graph data in a growing variety of forms. One example here would be RGraph.[13] As of 2011 there is a growing list of JavaScript libraries allowing to visualize data.
Publish data story
There are different options to publish data and visualizations. A basic approach is to attach the data to single stories, similar to embedding web videos. More advanced concepts allow to create single dossiers, e.g. to display a number of visualizations, articles and links to the data on one page. Often such specials have to be coded individually, as many Content Management Systems are designed to display single posts based on the date of publication.
Distribute data
Providing access to existing data is another phase, which is gaining importance. Think of the sites as "marketplaces" (commercial or not), where datasets can be found easily by others. Especially of the insights for an article where gained from Open Data, journalists should provide a link to the data they used for others to investigate (potentially starting another cycle of interogation, leading to new insights).
Providing access to data and enabling groups to discuss what information could be extracted is the main idea behind Buzzdata,[14] a site using the concepts of social media such as sharing and following to create a community for data investigations.
Other platforms (which can be used both to gather or to distribute data):
- Help Me Investigate (created by Paul Bradshaw)[15]
- Kasabi, (currently in public beta, Aug. 2011)[16]
- Timetric[17]
Measuring the impact of data stories
A final step of the process is to measure how often a dataset or visualization is viewed.
In the context of data-driven journalism the extend of such tracking, such as collecting user data or any other information that could be used for marketing reasons or other uses beyond the control of the user, should be viewed as problematic. One newer, non-intrusive option to measure usage, is a lightweight tracker called PixelPing. The tracker is the result of a project by ProPublica and DocumentCloud.[18] There is a corresponding backend solution to collect the data. The software is open source and can be downloaded via GitHub.[19]
Examples
There is a growing list of examples how data-driven journalism can be applied:
- The Guardian, being one of the pioneering media companies in this space, has compiled an extensive list of data stories, see: All of our data journalism in one spreadsheet[20]
Other prominent uses of data driven journalism is related to the release by whistle-blower organization WikiLeaks of the Afghan War Diary, a compendium of 91,000 secret military reports covering the war in Afghanistan from 2004 to 2010.[21] Three global broadsheets, namely The Guardian, The New York Times and Der Spiegel, dedicated extensive sections[22][23][24] to the documents; The Guardian's reporting included an interactive map pointing out the type, location and casualties caused by 16,000 IED attacks,[25] The New York Times published a selection of reports that permits rolling over underlined text to reveal explanations of military terms,[26] while Der Spiegel provided hybrid visualizations (containing both graphs and maps) on topics like the number deaths related to insurgent bomb attacks.[27]
Tutorials & Tools: How to get started with data-driven journalism
There is an open and helpful community of data-journalists, willing to share how raw data can be turned into good stories. Below is a selected list of posts worth reading.
Tutorials and How To's
- Simon Rogers: How to: get to grips with data journalism (2011)[28]
- Simon Rogers: Wikileaks' Afghanistan war logs: how our datajournalism operation worked (2010)[29]
- Paul Bradshaw: How to be a data journalist (2010)[30]
Tools
For each phase there are now different tools. Each tool might have certain features that are helpful to solve a specific problem working with data. Beginners interested in data-driven journalism should explore the options in order to have a stack of tools ready on their computers to work with data. From these resources journalists should step by step gain experience and create their own "tool stack" to become productive.
- Sharon Machlis (Computer World): 22 free tools for data visualization and analysis (2011)[31]
- Andy Kirk (Visualizing Data): Resources (extensive listing of platforms, tools, with a spreadsheet)[32]
See also
- Database journalism
- Computational journalism
- Open data
- Open source
- Open knowledge
- Freedom of information legislation
- Information visualization
References
- ^ Lorenz, Mirko (2010) Data driven journalism: What is there to learn? Edited conference documentation, based on presentations of participants, 24 August 2010, Amsterdam, The Netherlands
- ^ Lorenz, Mirko. (2010). Data driven journalism: What is there to learn? Presented at IJ-7 Innovation Journalism Conference, 7–9 June 2010, Stanford, CA
- ^ Bradshaw, Paul (1 October 2010). How to be a data journalist. The Guardian
- ^ http://owni.eu/2011/02/28/media-companies-must-become-trusted-data-hubs-catering-to-the-trust-market/
- ^ http://www.niemanlab.org/2011/03/voices-news-organizations-must-become-hubs-of-trusted-data-in-an-market-seeking-and-valuing-trust/
- ^ World Bank Data API
- ^ Cuzzillo, Ted (2010) http://datadoodle.com/2010/10/18/analyze-unfamiliar-data/
- ^ http://blog.ouseful.info/2008/10/14/data-scraping-wikipedia-with-google-spreadsheets/
- ^ http://www.openheatmap.com/
- ^ http://timetric.com/
- ^ http://blogs.journalism.co.uk/editors/2011/04/16/ijf11-lessons-in-data-journalism-from-the-new-york-times/
- ^ http://www.poynter.org/latest-news/top-stories/95154/using-data-visualization-as-a-reporting-tool-can-reveal-storys-shape/
- ^ http://www.rgraph.net/
- ^ http://buzzdata.com/
- ^ http://helpmeinvestigate.com/
- ^ http://www.kasabi.com/
- ^ http://www.timetric.com
- ^ http://www.propublica.org/nerds/item/pixel-ping-a-nodejs-stats-tracker
- ^ https://github.com/documentcloud/pixel-ping
- ^ Evans, Lisa (2011) http://www.guardian.co.uk/news/datablog/2011/jan/27/data-store-office-for-national-statistics
- ^ Kabul War Diary, 26 July 2010, WikiLeaks
- ^ Afghanistan The War Logs, 26 July 2010, The Guardian
- ^ The War Logs, 26 July 2010 The New York Times
- ^ The Afghanistan Protocol: Explosive Leaks Provide Image of War from Those Fighting It, 26 July 2010, Der Spiegel
- ^ Afghanistan war logs: IED attacks on civilians, coalition and Afghan troops, 26 July 2010, The Guardian
- ^ Text From a Selection of the Secret Dispatches, 26 July 2010, The New York Times
- ^ Deathly Toll: Death as a result of insurgent bomb attacks, 26 July 2010, Der Spiegel
- ^ Rogers, Simon (2011) http://www.journalism.co.uk/skills/how-to-get-to-grips-with-data-journalism/s7/a542402/
- ^ Rogers, Simon (2010) http://www.guardian.co.uk/news/datablog/2010/jul/27/wikileaks-afghanistan-data-datajournalism
- ^ Bradshaw, Paul (2010) http://www.guardian.co.uk/news/datablog/2010/oct/01/data-journalism-how-to-guide
- ^ Machlis, Sharon (2010) http://www.computerworld.com/s/article/9215504/22_free_tools_for_data_visualization_and_analysis
- ^ Kirk, Andy (2010) http://www.visualisingdata.com/index.php/resources/ Resources
External links
List of newspaper data desks
- Data Desk, The Los Angeles Times
- Datablog, The Guardian
- [1], The Texas Tribune
List of organizations interested in data driven journalism
Journalism Profession Areas Genres Advocacy · Analytic · Broadcast · Churnalism · Citizen · Civic · Collaborative · Community · Database · Gonzo · Investigative · Literary · Muckraking · Narrative · "New Journalism" · Non-profit journalism · Online · Opinion · Peace · Photojournalism · Scientific · Visual · Watchdog
Social impact News media Roles List of journalism articles Categories:- Journalism
- Journalism genres
- Online journalism

Wikimedia Foundation. 2010.