- CumFreq
-
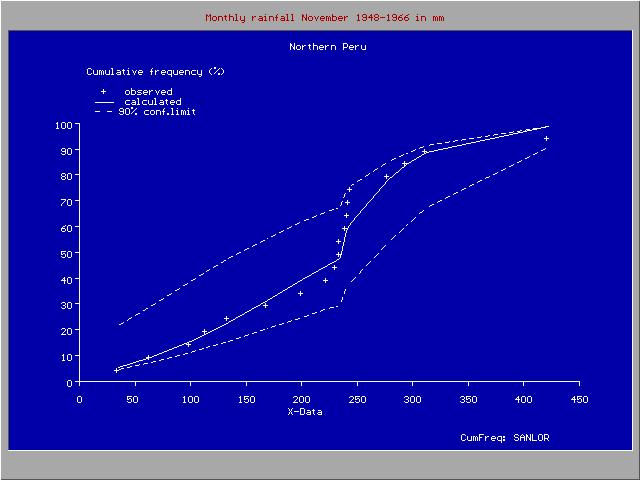
 Example of output graph
CumFreqDeveloper(s) Institute for Land Reclamation and Improvement (ILRI) Written in Delphi and Fortran Operating system Windows Available in English Type Statistical software License Freeware Website CumFreq In statistics and data analysis the application software CumFreq is a free and user-friendly tool for cumulative frequency analysis of a single variable and for probability distribution fitting.
Originally the method was developed for the analysis of hydrological measurements of spatially varying magnitudes (e.g. hydraulic conductivity of the soil) and of magnitudes varying in time (e.g. rainfall, river discharge) to find their return periods. However, it can be used for many other types of phenomena.
Features
 Screenprint of input tabsheet
 Discontnuous distribution
CumFreq uses the plotting position approach to estimate the cumulative frequency of each of the observed magnitudes in a data series of the variable.[1]
The computer program allows determination of the best fitting probability distribution. Alternatively it provides the user with the option to select the probability distribution to be fitted. The following probability distributions are included: normal, lognormal, logistic, loglogistic, exponential, Fréchet, Gumbel, Pareto, Weibull and others.
Further, the program can produce generalizations of the normal, logistic, and other distributions by transforming the data using an exponent that is optimized to obtain the best fit. This feature is not common in other distribution-fitting software which normally include only a logarithmic transformation of data obtaining distributions like the lognormal and loglogistic.
The software employs the binomial distribution to determine the confidence belt of the corresponding cumulative distribution function.[1] The prediction of the return period, which is of interest in time series, is also accompanied by a confidence belt. The construction of confidence belts is not found in most other software.
Another special characteristic of CumFreq is that it provides the option to use two different probability distributions, one for the lower data range, and one for the higher. The ranges are separated by a break-point. The use of discontinuous probability distributions can be useful when the data of the phenomenon studied were obtained under different conditions.
During the input phase, the user can select the number of intervals needed to determine the histogram. He may also define a threshold to obtain a truncated distribution.
 Nine return period curves of 50-year samples from a theoretical 1000 year record (base line)
The output section provides a calculator to facilitate interpolation and extrapolation.
ILRI [2] provides examples of application to magnitudes like crop yield, watertable depth, soil salinity, hydraulic conductivity, rainfall, and river discharge.
Need of confidence belts
The figure to the right shows the variation that may occur when obtaining samples of a variate that follows a certain probability distribution. The data were provided by Benson [3] .
The confidence belt around an experimental cumulative frequency or return period curve gives an impression of the region in which the true distribution may be found.
Also, it clarifies that the experimentally found best fitting probability distribution may deviate from the true distribution
References
- ^ a b Oosterban, R.J. (1994) Frequency and Regression Analysis. Chapter 6 in: H.P.Ritzema (ed., 1994), Drainage Principles and Applications, Publ. 16, pp. 175−224, International Institute for Land Reclamation and Improvement (ILRI), Wageningen, The Netherlands. ISBN 90 70754 3 39 . Free download as PDF from : ILRI website or from : [1]
- ^ Drainage research in farmers' fields: analysis of data, 2002. Contribution to the project “Liquid Gold” of the International Institute for Land Reclamation and Improvement (ILRI), Wageningen, The Netherlands. [2]
- ^ Benson, M.A. 1960. Characteristics of frequency curves based on a theoretical 1000 year record. In: T.Dalrymple (ed.), Flood frequency analysis. U.S. Geological Survey Water Supply paper 1543−A, pp. 51−71
Statistical software Public domain Open source Freeware Retail Category • Comparison Categories:- Free statistical software
- Free data analysis software

Wikimedia Foundation. 2010.