- Demographic history of Serbia
-
This article presents the demographic history of Serbia through census results. See Demographics of Serbia for a more detailed overview of the current demographics from 2002 census.
Middle Ages
1349


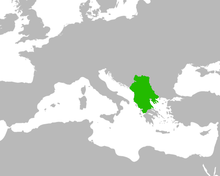
Serbian Empire ~1350
note that Serbia at the time included whole Albania, Montenegro, Republic of Macedonia, two thirds of Greece and smaller parts of Bulgaria, Bosnia and Herzegovina and Croatia.According to Dušan's Code, the legal code of the Emperor of the Serbs and Greeks Dušan the Mighty, the people of the Serbian Empire were:
People 1349 Serbs Greeks Arbanasi (Albanians) (mostly in Albania and some in Thessaly) Vlachs Saxons (Germanics) (mostly in miners' settlements) 1834-1863
The years after the Serbian Revolution saw frequent border changes of Serbia amidst the disintegration of the Austrian Empire and the Ottoman Empire.
Total population:
- 1834: 678,192
- 1841: 828,895
- 1843: 859,545
- 1846: 915,080
- 1850: 956,893
- 1854: 998,919
- 1859: 1,078.281
- 1863: 1,108.668
1866 census in Serbia
- TOTAL = 1,216,219[1]
- Serbs = 1,058,189 (87.01%)
- Romanians (Vlachs) = 127,545 (10.49%)
- Roma (Gypsies) = 24,607 (2.02%)
- Germans = 2,589 (0.21%)
- other = 3,256 (0.27%)
1878 census in Serbia
- TOTAL = 1,669,337[2]
1895 census in Serbia
- TOTAL = 2,493,770[2]
- Serbs = over 2 Mill. (ca. 90%)
- Romanians (Vlachs) = 159,000 (6.43%)
- Roma (Gipsies) = 46,000 (1.84%)
1921 census in Serbia
The 1921 census in Serbia (without Vojvodina, but including Kosovo and Macedonia)
- TOTAL = 4,133,478
- Serbs and Croats = 3,339,369 (80.87%)
- Albanians = 420,473 (10.17%)
- Vlachs = 159,549 (3.86%)
- Turks = 149,210 (3.61%)
- Germans = 5,969
- Russians = 4,176
- Slovenes = 3,625
- Czechs and Slovaks = 2,801
- Hungarians = 2,532
- French = 717
- Italians = 503
- Poles = 286
- English = 231
- Ruthenians = 35
- other (mostly Roma) = 44,002
1948 census in Serbia
- TOTAL = 6,527,966
- Serbs = 4,823,730 (73.89%)
- Albanians = 532,011 (8.15%)
- Hungarians = 433,701 (6.64%)
- Croats = 169,864 (2.60%)
- Montenegrins = 74,860 (1.15%)
- Roma = 52,181
- Slovenes = 20,998
- Macedonians = 17,917
- Muslims by nationality = 17,315
1953 census in Serbia
- TOTAL = 6,979,154
- Serbs = 5,152,939 (73.83%)
- Albanians = 565,513 (8.10%)
- Hungarians = 441,907 (6.33%)
- Croats = 173,246 (2.48%)
- Montenegrins = 86,061 (1.23%)
- Muslims by nationality = 81,081 (1.16%)
- Roma = 58,800
- Macedonians = 27,277
- Slovenes = 20,717
1961 census in Serbia
- TOTAL = 7,642,227
- Serbs = 5,704,686 (74.65%)
- Albanians = 699,772 (9.16%)
- Hungarians = 449,587 (5.88%)
- Croats = 196,409 (2.57%)
- Montenegrins = 104,753 (1.37%)
- Muslims by nationality = 93,467 (1.22%)
- Macedonians = 36,288
- Yugoslavs = 20,079
- Slovenes = 19,957
- Roma = 9,826
1971 census in Serbia
- TOTAL = 8,446,591
- Serbs = 6,016,811 (71.23%)
- Albanians = 984,761 (11.66%)
- Hungarians = 430,314 (5.10%)
- Croats = 184,913 (2.19%)
- Muslims by nationality = 154,330 (1.83%)
- Montenegrins = 125,260 (1.48%)
- Yugoslavs = 123,824 (1.47%)
- Slovaks = 76,733
- Romanians = 57,419
- Bulgarians = 53,800
- Roma = 49,894
- Macedonians = 42,675
- Rusyns = 20,608
- Turks = 18,220
- Slovenes = 15,957
- Vlachs = 14,724
1981 census in Serbia
- TOTAL = 9,313,677
- Serbs = 6,182,159 (66.38%)
- Albanians = 1,303,032 (13.99%)
- Yugoslavs = 441,941 (4.75%)
- Hungarians = 390,468 (4.19%)
- Muslims by nationality = 215,166 (2.31%)
- Croats = 149,368 (1.60%)
- Montenegrins = 147,466 (1.58%)
- Roma = 110,956 (1.19%)
- Macedonians = 48,986
- Slovenes = 12,006
1991 census in Serbia (including Kosovo)
- TOTAL (official estimation) = 9,778,991 (registered 8,182,141)
- Serbs = 6,446,595 (65.92%)
- Albanians (official estimation) = 1,674,353 (17.12%), registered 87,372
- Hungarians = 343,800 (3.52%)
- Yugoslavs = 323,643 (3.31%)
- Muslims by nationality (official estimation) = 246,411 (2.52%), registered 237,980
- Roma (official estimation) = 140,237 (1.43%), registered 138,799
- Montenegrins = 139,299 (1.42%)
- Croats = 105,406 (1.08%)
1991 census in Serbia (excluding Kosovo)
- TOTAL = 7,822,795
- Serbs = 6,252,405 (79.93%)
- Hungarians = 343,800 (4.39%)
- Yugoslavs = 320,186 (4.09%)
- Muslims by nationality = 180,222 (2.3%)
- Montenegrins = 118,934 (1.52%)
- Croats = 97,344 (1.24%)
- Roma = 94,491 (1.21%)
- Albanians = 78,281 (1%)
- Slovaks = 66,772 (0.85%)
- Macedonians = 45,068 (0.58%)
- Romanians = 42,316 (0.54%)
- Bulgarians = 26,698 (0.34%)
- Bunjevci = 21,434 (0.34%)
- Ukrainians = 18,052 (0.23%)
- Vlachs = 17,804 (0.23%)
- others = 34,698 (0.44%)
- unspecified = 10,538 (0.13%)
- regional affiliation = 4,841 (0.06%)
- unknown = 47,949 (0.61%)
2002 census in Serbia (excluding Kosovo)
- TOTAL = 7,498,001
- Serbs = 6,212,838 (82.86%)
- Hungarians = 293,299 (3.91%)
- Bosniaks = 136,087 (1.82%)
- Roma = 108,193 (1.44%)
- Yugoslavs = 80,721 (1.08%)
- Croats = 70,602 (0.94%)
- Montenegrins = 69,049 (0.92%)
- Albanians = 61,647 (0.82%)
- Slovaks = 59,021 (0.79%)
- Romanians (total) = 74,630 (0.74%), declared particularly as:
- Macedonians = 25,847 (0.35%)
- Bulgarians = 20,497 (0.27%)
- Bunjevci = 20,012 (0.27%)
- Muslims = 19,503 (0.26%)
- Rusyns = 15,905 (0.21%)
- Ukrainians = 5,354 (0.07%)
- Slovenes = 5,104
- Gorani = 4,581
- Germans = 3,901
- Czechs = 2,211
- others = 11,711 (0.19%)
- unspecified = 107,732 (1.44%)
- regional affiliation = 11,485 (0.15%)
- unknown = 75,483 (1.01%)
2011 census in Serbia (excluding Kosovo)
The 2011 census will give its results on October 15, 2011.[3]
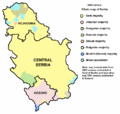
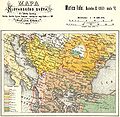
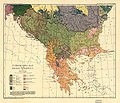
Ethnic maps of the territory of present-day Serbia
References
- ^ http://commons.wikimedia.org/wiki/File:Geographisches_Handbuch_zu_Andrees_Handatlas_1882_about_Serbia.JPG
- ^ a b http://commons.wikimedia.org/wiki/File:Geographisches_Handbuch_zu_Andrees_Handatlas_1902_about_Serbia.JPG
- ^ Population census begins in Serbia
- ^ Cartography in Central and Eastern Europe: Selected Papers of the 1st ICA Symposium on Cartography for Central and Eastern Europe; Georg Gartner, Felix Ortag; 2010; p.338
- ^ [http://www.hic.hr/books/greatserbia/cvijic.htm
See also
- Demographics of Serbia - current demographics
- Demographic history of Vojvodina
- Demographic history of Kosovo
- Ethnic groups of Vojvodina
Ethnic groups in Serbia Central Serbia Serbs · Albanians · Bosniaks · Ethnic Muslims · Bulgarians · Croats · Macedonians · Montenegrins · Roma · Romanians (Vlachs) · YugoslavsVojvodina Banat Bulgarians · Bunjevci · Croats (Šokci) · Germans (Danube Swabians and Banat Swabians) · Hungarians (Szekelys) · Montenegrins · Macedonians · Pannonian Rusyns · Roma · Serbs · Slovaks · Yugoslavs · Romanians · Czechs · Slovenes · Gorani people · Ukrainians · Albanians · RussiansKosovo[a] Demographic history of Serbia^a Kosovo is the subject of a territorial dispute between the Republic of Serbia and the self-proclaimed Republic of Kosovo. It declared independence on 17 February 2008, while Serbia claims it as part of its own sovereign territory. Its independence is recognised by 85 UN member states.Demographic history of Europe Sovereign
states- Albania
- Andorra
- Armenia
- Austria
- Azerbaijan
- Belarus
- Belgium
- Bosnia and Herzegovina
- Bulgaria
- Croatia
- Cyprus
- Czech Republic
- Denmark
- Estonia
- Finland
- France
- Georgia
- Germany
- Greece
- Hungary
- Iceland
- Ireland
- Italy
- Kazakhstan
- Latvia
- Liechtenstein
- Lithuania
- Luxembourg
- Macedonia
- Malta
- Moldova
- Monaco
- Montenegro
- Netherlands
- Norway
- Poland
- Portugal
- Romania
- Russia
- San Marino
- Serbia
- Slovakia
- Slovenia
- Spain
- Sweden
- Switzerland
- Turkey
- Ukraine
- United Kingdom
- (England
- Northern Ireland
- Scotland
- Wales)
States with limited
recognition- Abkhazia
- Kosovo
- Nagorno-Karabakh
- Northern Cyprus
- South Ossetia
- Transnistria
Dependencies
and other territories- Åland
- Faroe Islands
- Gibraltar
- Guernsey
- Jan Mayen
- Jersey
- Isle of Man
- Svalbard
Other entities Categories:
Wikimedia Foundation. 2010.


