- Demographic history of the Republic of Macedonia
-
History of the
Republic of Macedonia
This article is part of a seriesChronological Ottoman Macedonia Karposh's Rebellion National awakening Ilinden Uprising Kruševo Republic Vardar Banovina National Liberation War Anti-Fascist Assembly (ASNOM) National Liberation Front Exodus from Northern Greece Socialist Republic of Macedonia 1963 Skopje earthquake Republic of Macedonia 2001 Insurgency in Macedonia Ohrid Agreement Topical Military history Demographics History of the Macedonian people Related Region of Macedonia Naming Dispute Public Holidays
Republic of Macedonia Portal
This article presents the Demographic history of the Republic of Macedonia through census results. See Demographics of the Republic of Macedonia for a more detailed overview of the current demographics from 2002 census.
Contents
1948 census
- TOTAL = 1,152,986
- Macedonians = 789,603 (68.5%)
- Albanians = 197,603 (17.1%)
- Turks = 95,940 (8.3%)
- Serbs = 29,721 (2.6%)
- Roma = 19,500 (1.7%)
- Aromanians = 9,511 (0.8%)
- Montenegrins = 2,348 (0.2%)
- Croats = 2,090
- Muslims = 1,560
- Others = 5,324 (0.46%)
1953 census
- TOTAL = 1,394,514
- Macedonians = 860,699 (66%)
- Albanians = 162,524 (12.4%)
- Turks = 203,928 (15.6%)
- Roma = 20,462 (1.6%)
- Serbs = 35,112 (2.7%)
- Croats = 2,771
- Montenegrins = 2,526 (0.18%)
- Muslims = 1,591
- Others = 56,981 (1.07%)
1961 census
- TOTAL = 1,406,003
- Macedonians = 900,685 (71.2%)
- Albanians = 183,108 (13%)
- Turks = 131,481 (9.4%)
- Serbs = 42,728 (2.7%)
- Roma = 20,606 (1.5%)
- Croats = 3,801
- Montenegrins = 3,414 (0.24%)
- Yugoslavs = 1,260
- Muslims = 3,002
- Slovenes = 1,147
- Others = 90,549 (1.03%)
1971 census
- TOTAL = 1,647,308
- Macedonians = 1,142,375 (69.3%)
- Albanians = 279,871 (17%)
- Turks = 108,552 (6.6%)
- Roma = 24,505 (1.5%)
- Yugoslavs = 3,652 (0.24%)
- Serbs = 46,465 (2.85%)
- Aromanians = 7,000 (0.42%)
- Croats = 3,882
- Montenegrins = 3,246 (0.19%)
- Muslims = 1,248
- Others = 34,005 (1.55%)
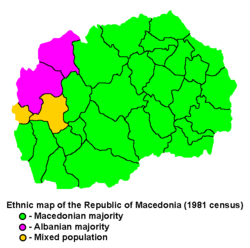
1981 census
- TOTAL = 1,909,146
- Macedonians = 1,279,323 (67%)
- Albanians = 377,208 (19.8%)
- Turks = 86,591 (4.5%)
- Roma = 43,125 (2.3%)
- Aromanians = 6,384 (0.3%)
- Serbs = 44,613 (2.3%)
- Muslims = 39,555 (2.2%)
- Yugoslavs = 14,240
- Croats = 3,349
- Montenegrins = 3,940 (0.21%)
- Others = 10,818 (0.56%)
1991 census
- TOTAL = 2,033,964
- Macedonians = 1,328,187 (65.3%)
- Albanians = 441,987 (21.73%)
- Turks = 77,080 (3.79%)
- Roma = 52,103 (2.56%)
- Aromanians = 7,764 (0.38%)
- Serbs = 42,755 (2.1%)
- Muslims = 31,356 (1.54%)
- Greeks = 474 (0.02%)
- Bulgarians = 1,370 (0.07%)
- Others = 50,888 (2.6%)
1994 census
- TOTAL = 1,936,877
- Macedonians = 1,288,330 (66.5%)
- Albanians = 442,914 (22.86%)
- Turks = 77,252 (4%)
- Roma = 43,732 (2.25%)
- Aromanians = 8,467(0.44%)
- Serbs = 39,620 (2.04%)
- Others = 34,960 (1.8%)
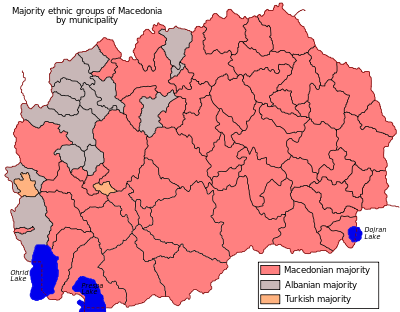
2002 census
- TOTAL = 2,022,547
- Macedonians: 1,297,981 (64.17%)
- Albanians: 509,083 (25.17%)
- Turks: 77,959 (3.85%)
- Roma: 53,879 (2.66%)
- Serbs: 35,939 (1.78%)
- Bosniaks 17,018 (0.84%)
- Aromanians: 9,695 (0.479%)
- Egyptians: 3,713 (0.184%)
- Croats: 2,686 (0.133%)
- Muslims: 2,553 (0.13%)
- Montenegrins: 2,003 (0.1%)
- Bulgarians: 1,418 (0.073%)
- Greeks: 422 (0.021%)
- Russians: 368 (0.018%)
- Slovenes: 365
- Poles: 162
- Ukrainians: 136
- Hungarians: 129
- Germans: 88
- Czechs: 60
- Slovaks: 60
- Jews: 53
- Italians: 46
- Austrians: 35
- Rusyns: 24
- Regionally affiliated: 829
- Non-declared: 404
- Others: 5,332 (0.264%)
See also
References
- Nasevski, Boško; Angelova, Dora. Gerovska, Dragica (1995). Македонски Иселенички Алманах '95. Skopje: Матица на Иселениците на Македонија.
- Statistical Yearbook of the Republic of Macedonia 2004 (CD version)
- 2002 Macedonian Census
External links
 Ethnic groups in the Republic of Macedonia
according to 2002 census data Over 10,000 people Macedonians (1,297,981) · Albanians (509,083) · Turks (77,959) · Roma (53,879) · Serbs (35,939) · Bosniaks (17,018)Under 10,000 people Other groups Torlaks (approx. 150,000) · Shopi (approx. 50,000) · Macedonian Muslims (40,000 - 100,000) · Gorani (approx. 2,500) · Megleno-Romanians (approx. 1,000) · Armenians (approx. 300) · Jews (approx. 200) · MontenegrinsDemographic history of the Republic of Macedonia Demographic history of Europe Sovereign
states- Albania
- Andorra
- Armenia
- Austria
- Azerbaijan
- Belarus
- Belgium
- Bosnia and Herzegovina
- Bulgaria
- Croatia
- Cyprus
- Czech Republic
- Denmark
- Estonia
- Finland
- France
- Georgia
- Germany
- Greece
- Hungary
- Iceland
- Ireland
- Italy
- Kazakhstan
- Latvia
- Liechtenstein
- Lithuania
- Luxembourg
- Macedonia
- Malta
- Moldova
- Monaco
- Montenegro
- Netherlands
- Norway
- Poland
- Portugal
- Romania
- Russia
- San Marino
- Serbia
- Slovakia
- Slovenia
- Spain
- Sweden
- Switzerland
- Turkey
- Ukraine
- United Kingdom
- (England
- Northern Ireland
- Scotland
- Wales)
States with limited
recognition- Abkhazia
- Kosovo
- Nagorno-Karabakh
- Northern Cyprus
- South Ossetia
- Transnistria
Dependencies
and other territories- Åland
- Faroe Islands
- Gibraltar
- Guernsey
- Jan Mayen
- Jersey
- Isle of Man
- Svalbard
Other entities Categories:
Wikimedia Foundation. 2010.


