- Montgomeryshire (UK Parliament constituency)
-
Coordinates: 52°38′24″N 3°28′08″W / 52.640°N 3.469°W
Montgomeryshire County constituency for the House of Commons 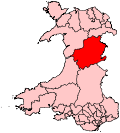
Boundary of Montgomeryshire in Wales.Preserved county Powys Electorate 48,910 (December 2010)[1] Major settlements Newtown, Welshpool Current constituency Created 1536 Member of Parliament Glyn Davies (Conservative) Number of members One Overlaps Welsh Assembly Mid and West Wales European Parliament constituency Wales Montgomeryshire (Welsh: Sir Drefaldwyn) is a constituency represented in the House of Commons of the Parliament of the United Kingdom. Created in 1542, it elects one Member of Parliament (MP), traditionally known as the knight of the shire, by the first-past-the-post system of election.
The Montgomeryshire Welsh Assembly constituency was created with the same boundaries in 1999.
Boundaries
The seat is based on the ancient county of Montgomeryshire, in the principal area of Powys. One of the UK's most rural and isolated constituencies, it has also been one of the small handful of seats that the Lib Dems (formerly the Liberal Party) could call safe, before a loss to the Conservatives in the 2010 General Election. Apart from this and a Conservative victory in the 1979 general election, Montgomeryshire has elected Liberal or Liberal-affiliated candidates since 1880. The seat was officially known as Montgomery before 1997.
Members of Parliament
1542–1604
- 1542 James Leche [2]
- 1545 Humphrey Lloyd [2]
- 1547 Humphrey Lloyd [2]
- 1553 (Mar) Edward Herbert [2]
- 1553 (Oct) Edward Herbert [2]
- 1554 (Apr) Edward Herbert [2]
- 1554 (Nov) Edward Herbert [2]
- 1555
- 1558 Edward Herbert [2]
- 1559 (Jan) Edward Herbert I [3]
- 1562–1563 Edward Herbert I [3]
- 1571 Edward Herbert I [3]
- 1572 John Price [3]
- 1584 (Oct) Richard Herbert [3]
- 1586 (Oct) Oliver Lloyd [3]
- 1588 (Oct) Edward Herbert / Arthur Price [3]
- 1593 Reginald Williams [3]
- 1597 (Sep) William Herbert [3]
- 1601 (Oct) Edward Herbert [3]
1604–present
Election Member[4] Party 1604–1611 William Herbert 1614 William Herbert 1621–1622 William Herbert 1624 William Herbert 1624–1629 William Herbert 1640 Richard Herbert 1640–1642 John Pryce 1642 Seat vacant from 12 September 1642, when Pryce was disabled from sitting 1647 Edward Vaughan 1648 Seat vacant after Vaughan was excluded in Pride's Purge 1653 Not separately represented in the Barebones Parliament 1654 - 1655
(Two Members)Charles Lloyd John Pryce 1656 - 1658
(Two Members)Charles Lloyd Hugh Pryce 1659 Edward Vaughan 1660 John Purcell 1661 Edward Vaughan 1661 Hon. Andrew Newport Tory 1679 Edward Vaughan 1719 Hon. Price Devereux 1740 Robert Williams 1741 Sir Watkin Williams Wynn Tory 1742 Robert Williams 1747 Edward Kynaston 1772 Watkin Williams 1774 William Mostyn Owen 1795 Francis Lloyd 1799 Charles Watkin Williams-Wynn Tory 1834 Conservative 1850 by-election Herbert Watkin Williams-Wynn Conservative 1862 by-election Charles Watkin Williams-Wynn Conservative 1880 Stuart Rendel Liberal 1894 by-election Arthur Humphreys-Owen Liberal 1906 David Davies Liberal 1929 Clement Davies Liberal 1931 National Liberal 1939 Independent 1942 Liberal 1962 Emlyn Hooson Liberal 1979 Delwyn Williams Conservative 1983 Alex Carlile SDP-Liberal Alliance 1988 Liberal Democrat 1997 Lembit Öpik Liberal Democrat 2010 Glyn Davies Conservative Elections
Elections in the 2010s
General Election 2010: Montgomeryshire [5][6] Party Candidate Votes % ±% Conservative Glyn Davies 13,976 41.3 +13.8 Liberal Democrat Lembit Öpik 12,792 37.8 -12.5 Plaid Cymru Heledd Fychan 2,802 8.3 +1.3 Labour Nick Colbourne 2,407 7.1 -5.2 UKIP David W L Rowlands 1,128 3.3 +0.4 National Front Milton Ellis 384 1.1 N/A Independent Bruce Lawson 324 1.0 N/A Majority 1,184 3.5 Turnout 33,813 69.4 +3.1 Conservative gain from Liberal Democrat Swing 13.2 Elections in the 2000s
General Election 2005: Montgomeryshire Party Candidate Votes % ±% Liberal Democrat Lembit Öpik 15,419 51.2 +1.8 Conservative Simon Baynes 8,246 27.4 -0.5 Labour David Tinline 3,454 11.5 -0.4 Plaid Cymru Ellen ap Gwynn 2,078 6.9 +0.1 UKIP Clive Easton 900 3.0 +0.3 Majority 7,173 23.8 +2.3 Turnout 30,097 64.4 -1.1 Liberal Democrat hold Swing +1.2 General Election 2001: Montgomeryshire Party Candidate Votes % ±% Liberal Democrat Lembit Öpik 14,319 49.4 +3.5 Conservative David Jones 8,085 27.9 +1.8 Labour Paul Davies 3,443 11.9 -7.3 Plaid Cymru David Senior 1,969 6.8 +1.8 UKIP David Rowlands 786 2.7 N/A ProLife Alliance Ruth Davies 210 0.7 N/A Independent Reginald Taylor 171 0.6 N/A Majority 6,234 21.5 +1.7 Turnout 28,983 65.5 -9.2 Liberal Democrat hold Swing Elections in the 1990s
General Election 1997: Montgomeryshire Party Candidate Votes % ±% Liberal Democrat Lembit Öpik 14,647 45.9 -2.6 Conservative Glyn Davies 8,344 26.1 -6.6 Labour Angharad Davies 6,109 19.1 +6.7 Plaid Cymru Helen Mary Jones 1,608 5.0 +0.3 Referendum Party John Bufton 879 2.8 N/A Green S. Walker 338 1.1 -0.4 Majority 6,303 19.7 +3.9 Turnout 31,925 74.9 -5.0 Liberal Democrat hold Swing General Election 1992: Montgomery[7] Party Candidate Votes % ±% Liberal Democrat Alex Carlile 16,031 48.5 +1.9 Conservative Jeannie France-Hayhurst 10,822 32.7 -5.8 Labour Steve Wood 4,115 12.4 +1.9 Plaid Cymru Hugh Parsons 1,581 4.8 +0.3 Green Patrick Adams 508 1.5 N/A Majority 5,209 15.8 +7.7 Turnout 33,057 79.9 +0.4 Liberal Democrat hold Swing Elections in the 1980s
General Election 1987: Montgomery Party Candidate Votes % ±% Liberal Alex Carlile 14,729 46.6 +3.3 Conservative David Evans 12,171 38.5 -2.6 Labour Edward Llewellyn-Jones 3,304 10.5 +1.9 Plaid Cymru C Clowes 1,412 4.5 -0.8 Majority 2,558 8.1 +5.8 Turnout 31,808 79.4 +0.2 Liberal hold Swing General Election 1983: Montgomery Party Candidate Votes % ±% Liberal Alex Carlile 12,863 43.3 +8.4 Conservative Delwyn Williams 12,195 41.1 +0.8 Labour Joe Wilson 2,550 8.6 -7.7 Plaid Cymru C Clowes 1,585 5.3 -3.2 Independent D W Rowlands 487 1.6 N/A Majority 668 2.3 Turnout 29,680 79.2 -2.2 Liberal gain from Conservative Swing Elections in the 1970s
General Election 1979: Montgomery Party Candidate Votes % ±% Conservative Delwyn Williams 11,751 40.3 +11.9 Liberal Emlyn Hooson 10,158 34.9 -8.2 Labour J Price 4,751 16.3 -2.9 Plaid Cymru C Clowes 2,474 8.5 -0.8 Majority 1,593 5.5 Turnout 29,134 81.4 +1.5 Conservative gain from Liberal Swing General Election, October 1974: Montgomery Party Candidate Votes % ±% Liberal Emlyn Hooson 11,280 43.1 -2.3 Conservative WRC Williams-Wynne 7,421 28.4 -0.5 Labour PW Harris 5,031 19.2 +1.4 Plaid Cymru AP Jones 2,440 9.3 +1 Majority 3,859 14.7 -2.2 Turnout 26,172 77.9 -4.7 Liberal hold Swing General Election, February 1974: Montgomery Party Candidate Votes % ±% Liberal Emlyn Hooson 12,495 45.4 +7 Conservative WRC Williams-Wynne 7,844 28.5 -1.2 Labour PW Harris 4,888 17.8 -2.3 Plaid Cymru AP Jones 2,274 8.3 -3.5 Majority 4,651 16.9 +8.2 Turnout 27,501 82.6 +0.3 Liberal hold Swing General Election, 1970: Montgomery Party Candidate Votes % ±% Liberal Emlyn Hooson 10,202 38.4 -3.1 Conservative Delwyn Williams 7,891 29.7 +2.3 Labour DW Thomas 5,335 20.1 -3.7 Plaid Cymru EJ Millward 3,145 11.8 +4.4 Majority 2,311 8.7 -5.4 Turnout 26,573 82.3 -0.5 Liberal hold Swing Elections in the 1960s
General Election, 1966: Montgomery Party Candidate Votes % ±% Liberal Emlyn Hooson 10,278 41.5 -0.8 Conservative AW Wiggin 6,784 27.4 +0.7 Labour GM Evans 5,891 23.8 +1.3 Plaid Cymru T Edwards 1,841 7.4 -1.1 Majority 3,494 14.1 -1.5 Turnout 24,794 82.8 -1.3 Liberal hold Swing General Election, 1964: Montgomery Party Candidate Votes % ±% Liberal Emlyn Hooson 10,738 42.3 +0.3 Conservative AW Wiggin 6,768 26.7 -4.7 Labour GM Evans 5,696 22.5 -4.1 Plaid Cymru Islwyn Ffowc Elis 2,167 8.5 N/A Majority 3,970 15.6 +4.9 Turnout 25,369 84.1 +0.3 Liberal hold Swing Montgomeryshire by-election, 1962 Party Candidate Votes % ±% Liberal Emlyn Hooson 13,181 51.3 +9.2 Conservative Robert H. Dawson 5,632 21.9 -9.4 Labour Tudor Davies 5,299 20.6 -6.0 Plaid Cymru Islwyn Ffowc Elis 1,594 6.2 N/A Majority 7,549 29.4 +18.6 Turnout 25,706 85.1 +1.3 Liberal hold Swing Elections in the 1950s
General Election, 1959: Montgomery Party Candidate Votes % ±% Liberal Clement Davies 10,970 42.0 -26 Conservative FL Morgan 8,176 31.3 N/A Labour DC Jones 6,950 26.6 -5.4 Majority 2,794 10.7 -25.4 Turnout 26,096 83.8 +10.2 Liberal hold Swing General Election, 1955: Montgomery Party Candidate Votes % ±% Liberal Clement Davies 16,021 68.0 -0.5 Labour DC Jones 7,521 32.0 +0.5 Majority 8,500 36.1 -0.9 Turnout 23,542 73.6 -3.3 Liberal hold Swing General Election, 1951: Montgomery Party Candidate Votes % ±% Liberal Clement Davies 17,075 68.5 +18.5 Labour DC Jones 7,854 31.5 +9 Majority 9,221 37.0 +13.4 Turnout 24,929 76.9 -12 Liberal hold Swing General Election, 1950: Montgomery Party Candidate Votes % ±% Liberal Clement Davies 14,401 50.0 -6.3 Conservative H West 7,621 26.5 -17.2 Labour JD Williams 6,760 23.5 N/A Majority 6,780 23.6 +8.6 Turnout 28,782 88.9 +11.5 Liberal hold Swing Elections in the 1940s
General Election, 1945: Montgomery Party Candidate Votes % ±% Liberal Clement Davies 14,018 56.3 Conservative PLW Owen 10,895 43.7 Majority 3,123 15.0 Turnout 24,913 77.4 Liberal hold Swing Elections in the 1930s
General Election, 1935: Montgomery Party Candidate Votes % ±% Liberal Clement Davies Unopposed - Turnout {{{votes}}} - Liberal hold Swing Elections in the 1910s
General Election, 1910: Montgomery Party Candidate Votes % ±% Liberal David Davies 4,369 61.83 Conservative A W W Wynn 2,697 38.17 Majority 1,672 23.66 Turnout 7,066 89.12 Liberal hold Swing Elections in the 1910s
General Election, 1906: Montgomery Party Candidate Votes % ±% Liberal David Davies Unopposed Liberal hold Swing General Election, 1900: Montgomery Party Candidate Votes % ±% Liberal Arthur Humphreys-Owen 3,482 Conservative ? 3,218 Liberal hold Swing Elections in the 1800s
General Election, 1892 Liberal Majority 27 General Election, 1892 Liberal Majority 815 General Election, 1886 Liberal Majority 579
See also
- Montgomeryshire (Assembly constituency)
- List of Parliamentary constituencies in Powys
- Montgomeryshire by-election, 1962
Notes and references
- ^ "Beyond 20/20 WDS - Table view". 2011 Electorate Figures. StatsWales. 1 December 2010. http://www.statswales.wales.gov.uk/TableViewer/tableView.aspx?ReportId=14666. Retrieved 13 March 2011.
- ^ a b c d e f g h "History of Parliament". http://www.historyofparliamentonline.org/volume/1509-1558/constituencies/montgomeryshire. Retrieved 2011-08-30.
- ^ a b c d e f g h i j "History of Parliament". http://www.historyofparliamentonline.org/volume/1558-1603/constituencies/montgomeryshire. Retrieved 2011-08-30.
- ^ Leigh Rayment's Historical List of MPs – Constituencies beginning with "M" (part 3)
- ^ Montgomeryshire Cyngor Sir Powys County Council Electoral Registration
- ^ "BBC NEWS – Election 2010 – Montgomeryshire". BBC News. http://news.bbc.co.uk/1/shared/election2010/results/constituency/w23.stm.
- ^ "Politics Resources". Election 1992. Politics Resources. 9 April 1992. http://www.politicsresources.net/area/uk/ge92/ge92index.htm. Retrieved 2010-12-06.
Sources
- Robert Beatson, A Chronological Register of Both Houses of Parliament (London: Longman, Hurst, Res & Orme, 1807) [1]
- D Brunton & D H Pennington, Members of the Long Parliament (London: George Allen & Unwin, 1954)
- Cobbett's Parliamentary history of England, from the Norman Conquest in 1066 to the year 1803 (London: Thomas Hansard, 1808) [2]
- F W S Craig, British Parliamentary Election Results 1832-1885 (2nd edition, Aldershot: Parliamentary Research Services, 1989)
- Robert Waller, The Almanac of British Politics (1st edition, London: Croom Helm, 1983)
Constituencies in Wales (40) Labour (26) Aberavon · Alyn and Deeside · Blaenau Gwent · Bridgend · Caerphilly · Cardiff South and Penarth · Cardiff West · Clwyd South · Cynon Valley · Delyn · Gower · Islwyn · Llanelli · Merthyr Tydfil and Rhymney · Neath · Newport East · Newport West · Ogmore · Pontypridd · Rhondda · Swansea East · Swansea West · Torfaen · Vale of Clwyd · Wrexham · Ynys Môn
Conservative (8) Aberconwy · Cardiff North · Carmarthen West and South Pembrokeshire · Clwyd West · Monmouth · Montgomeryshire · Preseli Pembrokeshire · Vale of Glamorgan
Liberal Democrats (3) Plaid Cymru (3) Categories:- Montgomeryshire
- Parliamentary constituencies in Mid Wales
- United Kingdom Parliamentary constituencies established in 1536

Wikimedia Foundation. 2010.