- Ogmore (UK Parliament constituency)
-
Not to be confused with Ogmore (Assembly constituency).
Ogmore County constituency for the House of Commons 
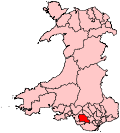
Boundary of Ogmore in Wales.Preserved county Mid Glamorgan Electorate 55,851 (December 2010)[1] Major settlements Maesteg, Pencoed Current constituency Created 1918 Member of Parliament Huw Irranca-Davies (Labour) Number of members One Created from Mid Glamorganshire Overlaps Welsh Assembly South Wales West European Parliament constituency Wales Ogmore (Welsh: Ogwr) is a county constituency represented in the House of Commons of the Parliament of the United Kingdom.
Contents
Boundaries
Taking its name from the River Ogmore, the constituency is situated close to the source of the river in the Ogwr valley and excludes the village of Ogmore-by-Sea, which is the seaside village of Bridgend (Pen-y-bont ar Ogwr). Ogmore constituency covers the area of Bridgend County Borough Council roughly north of the M4, and parts of Rhondda Cynon Taf County Borough Council. It includes the communities of Cefn Cribwr, Garw Valley, Gilfach Goch, Llanharan, Maesteg, Ogwr Valley, Pencoed, Sarn and Tondu.[2]
Members of Parliament
Like many seats in South Wales, Ogmore is a safe Labour seat, retaining it since its creation in 1918.
Election Member[3] Party 1918 Vernon Hartshorn Labour 1931 Edward John Williams Labour 1946 by-election John Evans Labour 1950 Walter Ernest Padley Labour 1979 Ray Powell Labour 2002 by-election Huw Irranca-Davies Labour Elections
Elections in the 2010s
General Election 2010: Ogmore [4][5] Party Candidate Votes % ±% Labour Huw Irranca-Davies 18,664 53.8 -7.1 Conservative Emma Moore 5,398 15.6 +1.4 Liberal Democrat Jackie Radford 5,260 15.2 +0.5 Plaid Cymru Danny Clark 3,326 9.6 -0.6 BNP Kay Thomas 1,242 3.6 N/A UKIP Carolyn Passey 780 2.3 N/A Majority 13,246 38.2 Turnout 34,650 62.4 +2.9 Labour hold Swing -4.3 Elections in the 2000s
Following the death of Sir Ray Powell on 7 December 2001 a by-election was held on 14 February 2002.
General Election 2005: Ogmore Party Candidate Votes % ±% Labour Huw Irranca-Davies 18,295 60.4 -1.6 Liberal Democrat Jackie Radford 4,592 15.2 +2.4 Conservative Norma Lloyd-Nesling 4,243 14.0 +2.9 Plaid Cymru John Williams 3,148 10.4 -3.6 Majority 13,703 45.3 Turnout 30,278 57.8 -0.4 Labour hold Swing -2.0 Ogmore by-election, 2002 Party Candidate Votes % ±% Labour Huw Irranca-Davies 9,548 52.0 -10.1 Plaid Cymru Bleddyn Hancock 3,827 20.8 +6.8 Liberal Democrat Veronica Watkins 1,608 8.8 -4.0 Conservative Guto Bebb 1,377 7.5 -3.7 Socialist Labour Christopher Herriot 1,152 6.3 +6.3 Green Jonathan Spink 250 1.4 n/a Socialist Alliance Jeffrey Hurford 205 1.1 n/a Monster Raving Loony Leslie Edwards 187 1.0 n/a New Millennium Bean Party Captain Beany 122 0.7 n/a Independent Rev David Braid 100 0.3 n/a Majority 5,721 31.1 -16.9 Turnout 18,376 35.2 -23.0 Labour hold Swing General Election 2001: Ogmore Party Candidate Votes % ±% Labour Ray Powell 18,833 62.0 -11.9 Plaid Cymru Angela Pulman 4,259 14.0 +7.0 Liberal Democrat Ian Lewis 3,878 12.8 +3.6 Conservative Richard Hill 3,383 11.1 +1.4 Majority 14,574 48.0 Turnout 30,353 58.2 -14.8 Labour hold Swing Elections in the 1990s
General Election 1992: Ogmore[6] Party Candidate Votes % ±% Labour Ray Powell 30,186 71.7 +2.4 Conservative David G. Edwards 6,359 15.1 +0.1 Liberal Democrat John Warman 2,868 6.8 −2.8 Plaid Cymru Miss Laura J. McAllister 2,667 6.3 +2.0 Majority 23,827 56.6 +2.3 Turnout 42,080 80.6 +1.2 Labour hold Swing +1.1 Elections in the 1940s
Ogmore by-election, 1946 Party Candidate Votes % ±% Labour John Evans 13,632 70.6 −5.8 Plaid Cymru T. R. Morgan 5,685 29.4 +23.8 Majority 7,947 41.2 −17.2 Turnout 19,317 75.6 −42.5 Labour hold Swing See also
- Ogmore (Assembly constituency)
- Ogmore by-election, 1946
- Ogmore by-election, 2002
- List of Parliamentary constituencies in Mid Glamorgan
Notes and references
- ^ "Beyond 20/20 WDS - Table view". 2011 Electorate Figures. StatsWales. 1 December 2010. http://www.statswales.wales.gov.uk/TableViewer/tableView.aspx?ReportId=14666. Retrieved 13 March 2011.
- ^ "Ogmore Constituency Labour Party". Ogmore Labour. 2008-07-20. http://www.cobwebs.uk.net/oclp/page1.html. Retrieved 2008-08-28.
- ^ Leigh Rayment's Historical List of MPs – Constituencies beginning with "O"
- ^ Ogmore Bridgend CBC - candidates Ogmore
- ^ Ogmore BBC Election - Ogmore
- ^ "Politics Resources". Election 1992. Politics Resources. 9 April 1992. http://www.politicsresources.net/area/uk/ge92/ge92index.htm. Retrieved 2010-12-06.
Sources
- Craig, F. W. S. (1983) [1969]. British parliamentary election results 1918-1949 (3rd edition ed.). Chichester: Parliamentary Research Services. ISBN 0-900178-06-X.
Constituencies in Wales (40) Labour (26) Aberavon · Alyn and Deeside · Blaenau Gwent · Bridgend · Caerphilly · Cardiff South and Penarth · Cardiff West · Clwyd South · Cynon Valley · Delyn · Gower · Islwyn · Llanelli · Merthyr Tydfil and Rhymney · Neath · Newport East · Newport West · Ogmore · Pontypridd · Rhondda · Swansea East · Swansea West · Torfaen · Vale of Clwyd · Wrexham · Ynys Môn
Conservative (8) Liberal Democrats (3) Plaid Cymru (3) Wales European constituency: Conservative (1) · Labour (1) · Plaid Cymru (1) · UKIP (1) Coordinates: 51°34′N 3°34′W / 51.567°N 3.567°W
Categories:- Parliamentary constituencies in South Wales
- Politics of Glamorgan
- United Kingdom Parliamentary constituencies established in 1918
- United Kingdom constituency stubs
Wikimedia Foundation. 2010.
