- Chatham-Kent—Essex (provincial electoral district)
-
Chatham-Kent—Essex  Ontario electoral district
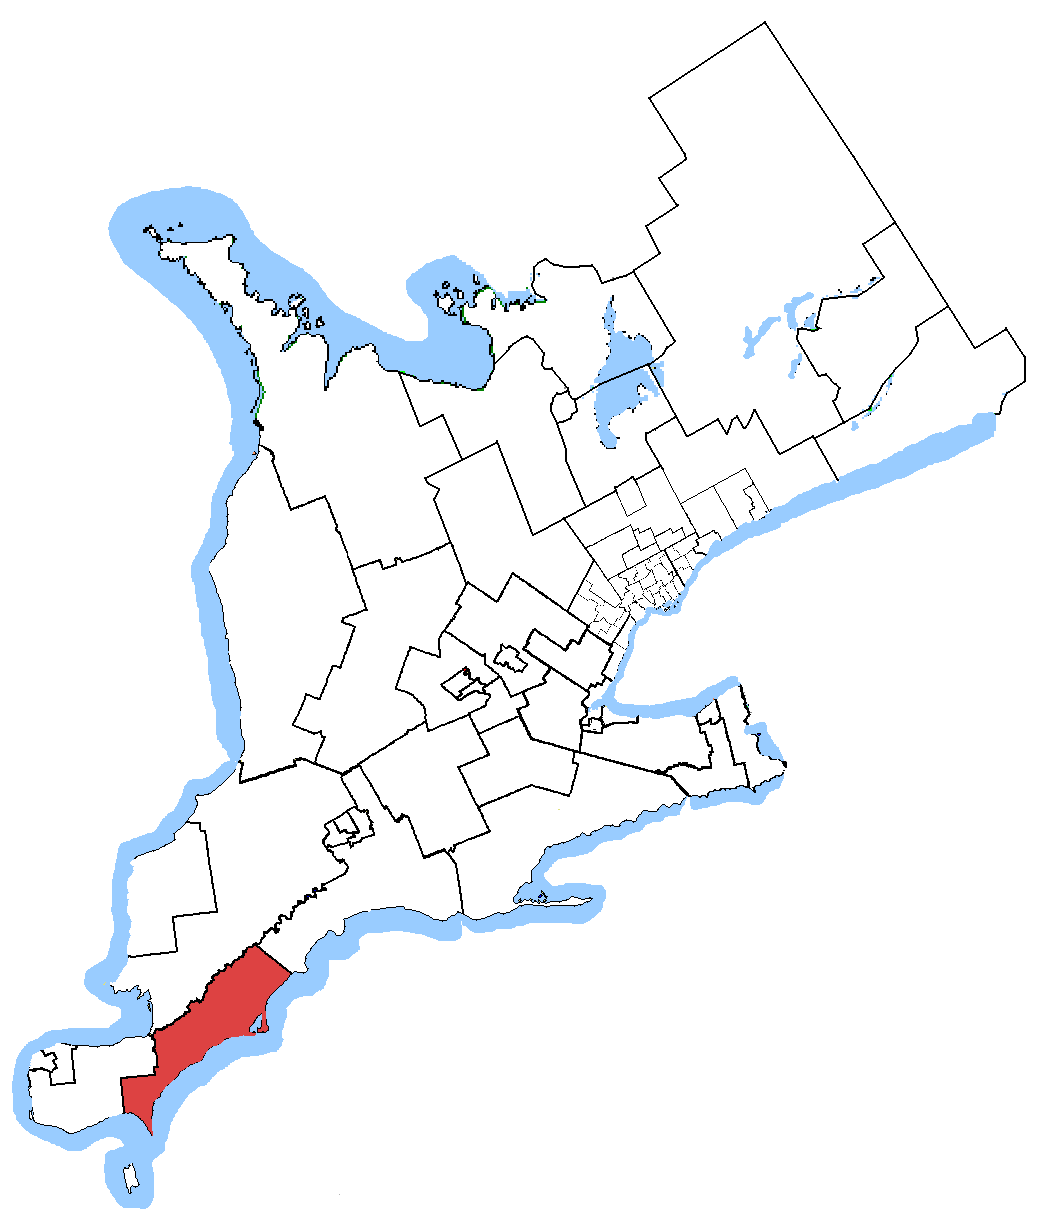
Chatham-Kent—Essex in relation to other southwestern Ontario electoral districts Provincial electoral district Legislature Legislative Assembly of Ontario MPP
Rick Nicholls
Progressive ConservativeDistrict created 1999 First contested 1999 Last contested 2011 Demographics Population (2006) 109,484 Electors (2007) 72,708 Area (km²) 1,924 Pop. density (per km²) 56.9 Census divisions Chatham-Kent, Essex County, Kent County Census subdivisions Chatham-Kent, Leamington, Mersea Township Chatham-Kent—Essex (formerly Chatham—Kent Essex) is a provincial electoral district in southwestern, Ontario, Canada. It elects one member to the Legislative Assembly of Ontario.
It was created in 1999 from parts of Essex—Kent, Chatham-Kent and Essex South.
When the riding was created, it included all of Kent County south of the Thames River, the city of Chatham, the town of Leamington and the Township of Mersea Township.
In 2007, the boundaries did not change.
Contents
Members of Provincial Parliament
This riding has elected the following members of the Legislative Assembly of Ontario:
Members
Assembly Years Member Party 37th 1999-2003 Pat Hoy Liberal 38th 2003-2007 39th 2007-2011 40th 2011-present Rick Nicholls Progressive Conservative Election results
Ontario general election, 2011 Party Candidate Votes % ±% Progressive Conservative Rick Nicholls 15,122 41.7 +13.1 Liberal Paul Watson 11,630 32.0 -19.9 New Democrat Aleksandra Navarro 8,522 23.5 +10.8 Green Holly Sullivan 1,027 2.8 -2.8 Total valid votes 36,301 100.00 Note: the 2011 election will be held on October 6, 2011.
Ontario general election, 2007 Party Candidate Votes % ±% Liberal Pat Hoy 18,782 51.96 -7.30 Progressive Conservative Doug Jackson 10,367 28.68 -1.14 New Democrat Murray Gaudreau 4,620 12.78 +5.33 Green Ken Bell 2,056 5.69 +2.94 Family Coalition Mark Morin 325 0.90 - Total valid votes 36,150 100.00 Ontario general election, 2003 Party Candidate Votes % ±% Liberal Pat Hoy 23,022 59.26 +3.22 Progressive Conservative Dave Wilkinson 11,586 29.82 -7.72 New Democrat Derry McKeever 2,893 7.45 +2.10 Green Jim Burgess 1,069 2.75 +1.68 Freedom David Rodman 281 0.72 - Total valid votes 38,851 100.00 Ontario general election, 1999 Party Candidate Votes % ±% Liberal Pat Hoy 24,239 56.04 - Progressive Conservative Jack Carroll 16,238 37.54 - New Democrat Brian Sharp 2,316 5.35 - Green Greg Zolad 462 1.07 - Total valid votes 43,255 100.00 2007 electoral reform referendum
Ontario electoral reform referendum, 2007 Side Votes % First Past the Post 24,235 69.3 Mixed member proportional 10,734 30.7 Total valid votes 34,969 100.0 Sources
Provincial ridings in Ontario Northern Eastern Glengarry—Prescott—Russell • Kingston and the Islands • Lanark—Frontenac—Lennox and Addington • Leeds—Grenville • Prince Edward—Hastings • Renfrew—Nipissing—Pembroke • Stormont—Dundas—South GlengarryCentral Barrie • Bruce—Grey—Owen Sound • Dufferin—Caledon • Durham • Haliburton—Kawartha Lakes—Brock • Newmarket—Aurora • Northumberland—Quinte West • Peterborough • Simcoe—Grey • Simcoe North • York—SimcoeMidwestern Brant • Cambridge • Guelph • Haldimand—Norfolk • Huron—Bruce • Kitchener Centre • Kitchener—Conestoga • Kitchener—Waterloo • Oxford • Perth—Wellington • Wellington—Halton HillsSouthwestern Chatham-Kent—Essex • Elgin—Middlesex—London • Essex • Lambton—Kent—Middlesex • London North Centre • London—Fanshawe • London West • Sarnia—Lambton • Windsor—Tecumseh • Windsor WestBrampton, Mississauga
& OakvilleHamilton, Burlington
& NiagaraAncaster—Dundas—Flamborough—Westdale • Burlington • Halton • Hamilton Centre • Hamilton East—Stoney Creek • Hamilton Mountain • Niagara Falls • Niagara West—Glanbrook • St. Catharines • WellandOttawa Carleton—Mississippi Mills • Nepean—Carleton • Ottawa Centre • Ottawa—Orléans • Ottawa South • Ottawa—Vanier • Ottawa West—NepeanSouth Durham, York Ajax—Pickering • Markham—Unionville • Oak Ridges—Markham • Oshawa • Pickering—Scarborough East • Richmond Hill • Thornhill • Vaughan • Whitby—OshawaToronto Beaches—East York • Davenport • Don Valley East • Don Valley West • Eglinton—Lawrence • Etobicoke Centre • Etobicoke—Lakeshore • Etobicoke North • Parkdale—High Park • Scarborough—Agincourt • Scarborough Centre • Scarborough—Guildwood • Scarborough—Rouge River • Scarborough Southwest • St. Paul's • Toronto Centre • Toronto—Danforth • Trinity—Spadina • Willowdale • York Centre • York South—Weston • York WestCategories:- Ontario provincial electoral districts
Wikimedia Foundation. 2010.