- Ottawa Centre (provincial electoral district)
-
For the federal electoral district, see Ottawa Centre.
Coordinates: 45°25′N 75°42′W / 45.417°N 75.7°W
Ottawa Centre  Ontario electoral district
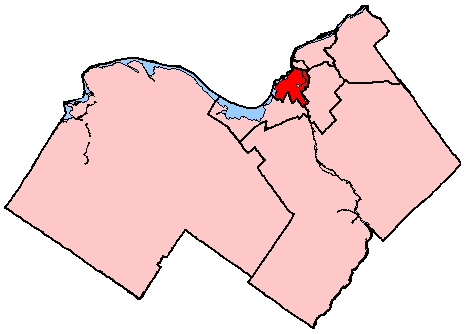
Ottawa Centre in relation to other Ottawa electoral districts Provincial electoral district Legislature Legislative Assembly of Ontario MPP
Yasir Naqvi
LiberalDistrict created 1966 First contested 1968 Last contested 2007 Demographics Population (2006) 109,336 Electors (2007) 86,426 Area (km²) 35 Pop. density (per km²) 3,123.9 Census divisions Ottawa Census subdivisions Ottawa Ottawa Centre is an urban provincial electoral district in Ontario, Canada that has been represented in the Legislative Assembly of Ontario since 1968. While the riding's boundaries (mainly to the south and west as the north and east borders have remained the Ottawa River and Rideau Canal, respectively) have changed over the years to account for population changes, the riding has always comprised the central areas of Ottawa, the nation's capital.
Contents
History
The district was created before the 1967 election. Since the 1999 election, the provincial district has had the same borders as the federal riding of Ottawa Centre.
It is represented in the Legislative Assembly of Ontario by Ontario Liberal Yasir Naqvi. The provincial riding has been won by the NDP seven times (1971, 1975, 1977, 1981, 1984 by-election, 1985 and 1990) and by the Liberals six times (1968, 1987, 1995, 1999, 2003) and 2007, and never by the Conservatives or another party.
Geography
The riding covers most of downtown Ottawa, including the Parliament Buildings. From the historic Rideau Canal, the riding stretches west encompassing the neighbourhoods of Downtown, Centretown (Centretown West which includes Little Italy is usually considered a distinct neighbourhorhood), Lebreton Flats, Mechanicsville, Hintonburg and Westboro. The riding encompasses additional neighbourhoods south of downtown, including The Glebe, Old Ottawa South, Lees Avenue, Old Ottawa East and others.
Party support varies between different parts of the riding. The consistently best areas for the Ontario New Democratic Party (NDP) are Old Ottawa South, the Glebe, and Centretown. Old Ottawa South and the Glebe are also the main Green party areas. The suburban far south and west of the riding around Hog's Back and Carlingwood Park, the large homes near the Civic Hospital, the expensive homes and apartments by the Rideau Canal, and the more expensive downtown condos are the most strongly Liberal and Conservative areas. The major swing areas are the western portions of the riding such as Hintonburg and Westboro: while traditionally Liberal, these neighbourhoods have recently become stronger for the NDP.
Many public sector workers live in the riding. The northern part of the riding contains many government office buildings, including Parliament Hill. The riding also includes Carleton University and Saint Paul University's campuses and residences.
Members of Provincial Parliament
Parliament Years Member Party 28th 1967–1971 Harold MacKenzie Liberal 29th 1971–1975 Michael Cassidy New Democratic Party 30th 1975–1977 31st 1977–1981 32nd 1981–1985 33rd 1985–1987 Evelyn Gigantes
1st termNew Democratic Party 34th 1987–1990 Richard Patten
1st termLiberal 35th 1990–1995 Evelyn Gigantes
2nd termNew Democratic Party 36th 1995–1999 Richard Patten
2nd termLiberal 37th 1999–2003 38th 2003–2007 39th 2007- Yasir Naqvi Election results
Ontario general election, 2011 Party Candidate Votes % ±% Liberal Yasir Naqvi - New Democrat Anil Naidoo - Progressive Conservative Rob Dekker - Green Kevin O'Donnell - Independent Kristina Chapman - Communist Stuart Ryan -  Election signs for the major party Ottawa Centre candidates during the 2007 election.
Ontario general election, 2007 Party Candidate Votes % ±% Liberal Yasir Naqvi 18,239 35.0 -10.1 New Democrat Will Murray 16,074 30.8 +7.8 Progressive Conservative Trina Morissette 10,410 20.0 -2.7 Green Greg Laxton 6,438 12.3 +4.6 Family Coalition Danny Moran 508 1.0 - Independent Richard Eveleigh 284 0.5 - Communist Stuart Ryan 205 0.4 -0.2 Total valid votes 52,158 100.0 Ontario general election, 2003 Party Candidate Votes % ±% Liberal Richard Patten 22,295 45.1 +6.9 New Democrat Jeff Atkinson 11,362 23.0 -2.5 Progressive Conservative Joe Varner 11,217 22.7 -10.0 Green Chris Bradshaw 3,821 7.7 +5.1 Communist Stuart Ryan 306 0.6 +0.2 Freedom Matt Szymanowicz 218 0.4 - Independent Fakhry Guirguis 214 0.4 - Total valid votes 49,433 100.0 Ontario general election, 1999 Party Candidate Votes % ±% Liberal Richard Patten 17,956 38.2 -1.1 Progressive Conservative Ray Kostuch 15,403 32.7 +9.1 New Democrat Elisabeth Arnold 11,977 25.5 -7.7 Green Chris Bradshaw 1,231 2.6 +1.4 Communist Marvin Glass 174 0.4 -0.3 Natural Law Wayne Foster 170 0.4 -0.9 Independent Mistahi Corkill 132 0.3 - Total valid votes 47,043 100.0 Ontario general election, 1995 Party Candidate Votes % ±% Liberal Richard Patten 11,150 39.3 +1.0 New Democrat Evelyn Gigantes 9,438 33.2 -14.5 Progressive Conservative Chris Thompson 6,715 23.6 +14.7 Natural Law Ron Parker 365 1.3 - Green Andrew Van Iterson 349 1.2 -0.7 Communist Malek Khouri 210 0.7 - Independent John C. Turmel 173 0.6 +0.1 Total valid votes 28,400 100.0 Ontario general election, 1990 Party Candidate Votes % ±% New Democrat Evelyn Gigantes 14,522 47.7 +7.6 Liberal Richard Patten 11,656 38.3 -8.9 Progressive Conservative Alex Burney 2,723 8.9 -1.8 Family Coalition John Gray 809 2.7 - Green Bill Hipwell 576 1.9 - Independent John C. Turmel 160 0.5 -1.5 Total valid votes 30,446 100.0 Ontario general election, 1987 Party Candidate Votes % ±% Liberal Richard Patten 13,867 47.2 +21.2 New Democrat Evelyn Gigantes 11,780 40.1 -3.4 Progressive Conservative Greg Vezina 3,159 10.7 -18.6 Independent John C. Turmel 598 2.0 +0.7 Total valid votes 29,404 100.0 Ontario general election, 1985 Party Candidate Votes % ±% New Democrat Evelyn Gigantes 11,890 43.5 +1.7 Progressive Conservative Graham Bird 8,005 29.3 -0.7 Liberal Pat Legris 7,103 26.0 -0.6 Independent John C. Turmel 364 1.3 +0.8 Total valid votes 27,362 100.0 By-election on December 13, 1984 Party Candidate Votes % ±% New Democrat Evelyn Gigantes 8,165 41.8 +5.0 Progressive Conservative Graham Bird 5,870 30.0 -4.4 Liberal Lowell Green 5,202 26.6 +7.0 Green Greg Vezina 130 0.7 - Independent Ray Joseph Cormier 94 0.5 - Independent John C. Turmel 90 0.5 -0.6 Total valid votes 19,551 100.0 Ontario general election, 1981 Party Candidate Votes % ±% New Democrat Michael Cassidy 9,316 36.77 -4.8 Progressive Conservative David Small 8,717 34.41 +2.2 Liberal Karl Feige 6,926 27.34 +2.4 Independent John C. Turmel 376 1.48 - Total valid votes 25,335 100.0 Ontario general election, 1977 Party Candidate Votes % ±% New Democrat Michael Cassidy 10,626 41.6 +2.7 Progressive Conservative Brian Cameron 8,223 32.2 -0.6 Liberal Ian Kimmerly 6,358 24.9 -2.5 Communist Marvin Glass 360 1.4 +0.5 Total valid votes 25,567 100.0 Ontario general election, 1975 Party Candidate Votes % ±% New Democrat Michael Cassidy 10,658 38.9 +3.4 Progressive Conservative Gale Kerwin 8,978 32.8 -1.9 Liberal Gerald Kirby 7,500 27.4 -2.5 Communist Marvin Glass 250 0.9 - Total valid votes 27,386 100.0 Ontario general election, 1971 Party Candidate Votes % ±% New Democrat Michael Cassidy 8,075 35.5 +17.6 Progressive Conservative Garry Guzzo 7,893 34.7 -4.4 Liberal Rudy Capogreco 6,804 29.9 -13.2 Total valid votes 22,772 100.0 Ontario general election, 1967 Party Candidate Votes % ±% Liberal Harold MacKenzie 7,688 43.1 - Progressive Conservative Ivan Sparks 6,973 39.1 - New Democrat Ivan Greenberg 3,190 17.9 - Total valid votes 17,851 100.0 2007 electoral reform referendum
Ontario electoral reform referendum, 2007 Side Votes % First Past the Post 26,586 52.1 Mixed Member Proportional 24,443 47.9 Total 51,029 100.0 Constituency associations
Sources
Provincial ridings in Ontario Northern Eastern Glengarry—Prescott—Russell • Kingston and the Islands • Lanark—Frontenac—Lennox and Addington • Leeds—Grenville • Prince Edward—Hastings • Renfrew—Nipissing—Pembroke • Stormont—Dundas—South GlengarryCentral Barrie • Bruce—Grey—Owen Sound • Dufferin—Caledon • Durham • Haliburton—Kawartha Lakes—Brock • Newmarket—Aurora • Northumberland—Quinte West • Peterborough • Simcoe—Grey • Simcoe North • York—SimcoeMidwestern Brant • Cambridge • Guelph • Haldimand—Norfolk • Huron—Bruce • Kitchener Centre • Kitchener—Conestoga • Kitchener—Waterloo • Oxford • Perth—Wellington • Wellington—Halton HillsSouthwestern Chatham-Kent—Essex • Elgin—Middlesex—London • Essex • Lambton—Kent—Middlesex • London North Centre • London—Fanshawe • London West • Sarnia—Lambton • Windsor—Tecumseh • Windsor WestBrampton, Mississauga
& OakvilleHamilton, Burlington
& NiagaraAncaster—Dundas—Flamborough—Westdale • Burlington • Halton • Hamilton Centre • Hamilton East—Stoney Creek • Hamilton Mountain • Niagara Falls • Niagara West—Glanbrook • St. Catharines • WellandOttawa Carleton—Mississippi Mills • Nepean—Carleton • Ottawa Centre • Ottawa—Orléans • Ottawa South • Ottawa—Vanier • Ottawa West—NepeanSouth Durham, York Ajax—Pickering • Markham—Unionville • Oak Ridges—Markham • Oshawa • Pickering—Scarborough East • Richmond Hill • Thornhill • Vaughan • Whitby—OshawaToronto Beaches—East York • Davenport • Don Valley East • Don Valley West • Eglinton—Lawrence • Etobicoke Centre • Etobicoke—Lakeshore • Etobicoke North • Parkdale—High Park • Scarborough—Agincourt • Scarborough Centre • Scarborough—Guildwood • Scarborough—Rouge River • Scarborough Southwest • St. Paul's • Toronto Centre • Toronto—Danforth • Trinity—Spadina • Willowdale • York Centre • York South—Weston • York WestSee also: 2007 election • List of elections • Politics of Ontario Categories:- Provincial electoral districts of Ottawa

Wikimedia Foundation. 2010.