- Mississauga South (provincial electoral district)
-
For the federal electoral district, see Mississauga South.
Mississauga South (provincial electoral district)  Ontario electoral district
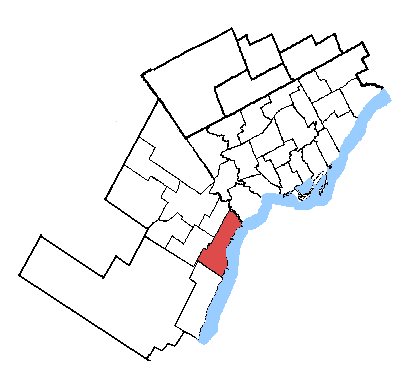
Mississauga South in relation to the other Toronto area ridings Provincial electoral district Legislature Legislative Assembly of Ontario MPP
Charles Sousa
LiberalDistrict created First contested 1975 Last contested 2011 Demographics Population (2006) 113,003 Electors (2011) 77,479 Area (km²) 61 Pop. density (per km²) 1,852.5 Census divisions Peel Census subdivisions Mississauga  Map of Mississauga South
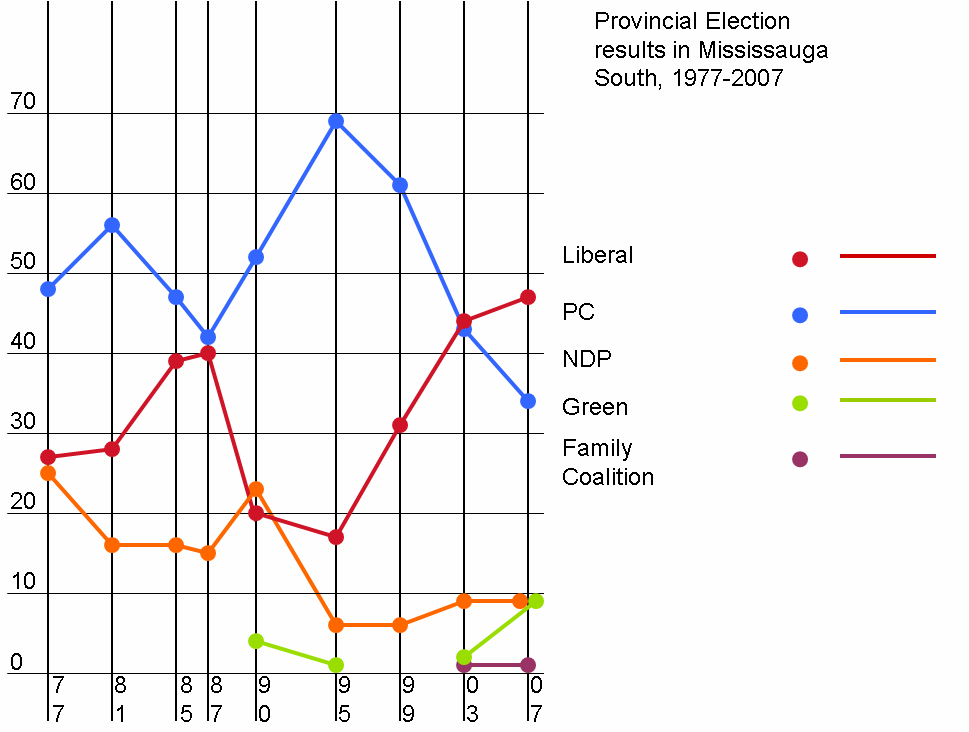
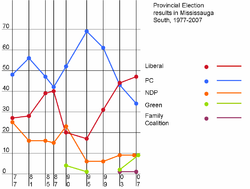 Provincial election results, 1977-2007
Mississauga South is a provincial electoral district in Ontario, Canada, that has been represented in the Legislative Assembly of Ontario since 1975.
It includes the neighbourhoods of Cawthra, Sheridan Heights, Park Royal, Clarkson, Rattray Park Estates, Lorne Park, Lorne Park Estates, Port Credit, Applewood Acres, Lakeview and Orchard Heights. It has a population of 113,003 and an area of 61 km2.
In 2003, it was defined to consist of the part of the City of Mississauga lying southeast of a line drawn from northeast to southwest along the Queensway to the Credit River, west along the Credit River, and southwest along Dundas Street West to the southwestern city limit.
Contents
Members of Provincial Parliament
This riding has elected the following members of the Legislative Assembly of Ontario:
- Douglas Kennedy, Progressive Conservative (1975–1985)
- Margaret Marland, Progressive Conservative (1985–2003)
- Tim Peterson, Liberal (2003–2007), Independent (2007), Progressive Conservative (2007)
- Charles Sousa, Liberal (2007–present)
Electoral history
Once one of the strongest bastions of PC support in the province (winning 61% of the vote as recently as 1999), and certainly in the Toronto area, Mississauga South provincially has become more and more Liberal in last election cycles, which can be attributed to the demographics of Mississauga South changing, with more socially-liberal-minded young families moving from Toronto into the area, and increasing ethnic populations which are usually Liberal friendly. Prior to Tim Peterson's very narrow upset victory in 2003 (despite a Liberal landslide province-wide, most pundits had predicted PC incumbent Margaret Marland would hold on to the seat), the area had not voted Liberal provincially since Confederation, and the PCs generally held the riding fairly easily (with some exceptions such as the 1987 election, which the PCs won by less than 1000 votes). The riding was one of the most watched in the 2007 election, as it was expected to be one of the closest races in the province. The voters, however, differed from expectations, handing Liberal Charles Sousa a more than 5000-vote victory, as the PC vote fell almost 9% from 2003, which many[who?] viewed as a rejection of the automatic installing of floor-crossing Tim Peterson as the PC candidate. The Liberals and particularly the Green Party received the benefit of angry PC voters, seeing a 3% and a 6% rise in voting percentage, respectively.
Voters also rejected the proposal to change Ontario's electoral system from first past the post (FPTP) to mixed member proportional (MMP) in the 2007 electoral reform referendum. The status quo FPTP received 65% of the vote. Given the margin and the parties' and the candidates' positions on MMP (Peterson and the PCs against, Sousa undecided and the Liberals neutral, Cole and the NDP in favour, and Johnson and the Greens in favour), it appears that the vast majority of NDP/Green voters voted in favour of MMP, the vast majority of PC voters for FPTP, and the majority of Liberals for FPTP, with a sizeable minority voting for MMP.
Election results
Template:Ontario elections/Vegan Environmental
Ontario general election, 2011 Party Candidate Votes % ±% Liberal Charles Sousa 20,244 50.6 +3.8 Progressive Conservative Geoff Janoscik 14,446 36.1 +1.7 New Democrat Anju Sikka 4,044 10.1 +1.0 Green Cory Mogk 857 2.1 -6.7 Freedom Mark Harris 238 0.6 - Paul Figueiras 165 0.4 - Total valid votes 39,994 100.0 Ontario general election, 2007 Party Candidate Votes % ±% Liberal Charles Sousa 19,195 46.8 +3.0 Progressive Conservative Tim Peterson 14,114 34.4 -8.8 New Democrat Ken Cole 3,745 9.1 -0.7 Green David Johnston 3,627 8.8 +6.4 Family Coalition Samantha Toteda 345 0.8 -0.6 Total valid votes 41,026 100.0 Ontario general election, 2003 Party Candidate Votes % ±% Liberal Tim Peterson 17,211 43.8 +12.3 Progressive Conservative Margaret Marland 16,977 43.2 -18.1 New Democrat Ken Cole 3,606 9.2 +3.3 Green Pamela Murray 949 2.4% - Family Coalition Alfred Zawadzki 555 1.4% - Total valid votes 39,298 100.0% Ontario general election, 1999 Party Candidate Votes % ±% Progressive Conservative Margaret Marland 23,890 61.3 -8.5 Liberal Ieva Martin 12,275 31.5 +14.7 New Democrat Ken Cole 2,293 5.9 - Independent Tim Sullivan 535 1.4 - Total valid votes 38,993 100.0 Ontario general election, 1995 Party Candidate Votes % ±% Progressive Conservative Margaret Marland 23,116 69.8 +17.3 Liberal Ieva Martin 5,551 16.8 -3.5 New Democrat David Messanger 3,282 5.9 -17.3 Natural Law Scott Kay 334 1.0 - Independent Adrian Earl Crewson 309 0.9 - Independent Wolfgang G. Mueller 287 0.9 - Green Matthew Wood 256 0.8 -3.3 Total valid votes 33,135 100.0 Ontario general election, 1990 Party Candidate Votes % ±% Progressive Conservative Margaret Marland 17,126 52.5 +10.3 New Democrat Sue Craig 7,579 23.2 +8.0 Liberal Donna Scott 6,624 20.3 -20.1 Green Scott McWhinnie 1,323 4.1 - Total valid votes 32,652 100.0 Ontario general election, 1987 Party Candidate Votes % ±% Progressive Conservative Margaret Marland 13,854 42.2 -2.3 Liberal Claudette Mackay-Lassonde 13,255 40.4% +1.1 New Democrat Barry Stevens 4,976 15.2 -1.0 Freedom Chris Balabanian 712 2.2 - Total valid votes 32,797 100.0 Ontario general election, 1985 Party Candidate Votes % ±% Progressive Conservative Margaret Marland 13,186 44.6 -11.1 Liberal Carolynne Siller 11,623 39.3 +11.1 New Democrat Barry Stevens 4,770 16.1 -0.1 Total valid votes 29,579 100.0 Ontario general election, 1981 Party Candidate Votes % ±% Progressive Conservative Douglas Kennedy 14,165 55.6 +7.7 Liberal Basil Gerol 7,172 28.2 +1.4 New Democrat Neil Davis 4,126 16.2 -9.1 Total valid votes 25,463 100.0 Ontario general election, 1977 Party Candidate Votes % ±% Progressive Conservative Douglas Kennedy 13,622 47.9 - Liberal Mike Garvey 7,616 26.8 - New Democrat Ted Humphreys 7,196 25.3 - Total valid votes 28,434 100.0 2007 electoral reform referendum
Ontario electoral reform referendum, 2007 Side Votes % First Past the Post 26,121 65.1 Mixed member proportional 13,985 34.9 Total valid votes 40,106 100.0 Sources
Provincial ridings in Ontario Northern Eastern Glengarry—Prescott—Russell • Kingston and the Islands • Lanark—Frontenac—Lennox and Addington • Leeds—Grenville • Prince Edward—Hastings • Renfrew—Nipissing—Pembroke • Stormont—Dundas—South GlengarryCentral Barrie • Bruce—Grey—Owen Sound • Dufferin—Caledon • Durham • Haliburton—Kawartha Lakes—Brock • Newmarket—Aurora • Northumberland—Quinte West • Peterborough • Simcoe—Grey • Simcoe North • York—SimcoeMidwestern Brant • Cambridge • Guelph • Haldimand—Norfolk • Huron—Bruce • Kitchener Centre • Kitchener—Conestoga • Kitchener—Waterloo • Oxford • Perth—Wellington • Wellington—Halton HillsSouthwestern Chatham-Kent—Essex • Elgin—Middlesex—London • Essex • Lambton—Kent—Middlesex • London North Centre • London—Fanshawe • London West • Sarnia—Lambton • Windsor—Tecumseh • Windsor WestBrampton, Mississauga
& OakvilleBramalea—Gore—Malton • Brampton—Springdale • Brampton West • Mississauga—Brampton South • Mississauga East—Cooksville • Mississauga—Erindale • Mississauga South • Mississauga—Streetsville • OakvilleHamilton, Burlington
& NiagaraAncaster—Dundas—Flamborough—Westdale • Burlington • Halton • Hamilton Centre • Hamilton East—Stoney Creek • Hamilton Mountain • Niagara Falls • Niagara West—Glanbrook • St. Catharines • WellandOttawa Carleton—Mississippi Mills • Nepean—Carleton • Ottawa Centre • Ottawa—Orléans • Ottawa South • Ottawa—Vanier • Ottawa West—NepeanSouth Durham, York Ajax—Pickering • Markham—Unionville • Oak Ridges—Markham • Oshawa • Pickering—Scarborough East • Richmond Hill • Thornhill • Vaughan • Whitby—OshawaToronto Beaches—East York • Davenport • Don Valley East • Don Valley West • Eglinton—Lawrence • Etobicoke Centre • Etobicoke—Lakeshore • Etobicoke North • Parkdale—High Park • Scarborough—Agincourt • Scarborough Centre • Scarborough—Guildwood • Scarborough—Rouge River • Scarborough Southwest • St. Paul's • Toronto Centre • Toronto—Danforth • Trinity—Spadina • Willowdale • York Centre • York South—Weston • York WestSee also: 2007 election • List of elections • Politics of Ontario Categories:- Ontario provincial electoral districts
- Politics of Mississauga

Wikimedia Foundation. 2010.