- List of countries by military expenditures
-
This is a list of countries by military expenditures. The first list is based on the Stockholm International Peace Research Institute (SIPRI) database which gives military expenditures in 2010 (in constant 2009 US$). The second list is based on the SIPRI Yearbook 2010 which includes a list on the world's top 15 military spenders in 2009 at current exchange rates.Contents
SIPRI Military Expenditure Database
This list is based on the Stockholm International Peace Research Institute (SIPRI) Military Expenditure Database for 2010 (in constant 2009 US$). It also includes military expenditure data as a percentage of gross domestic product (GDP) in 2009.[1]

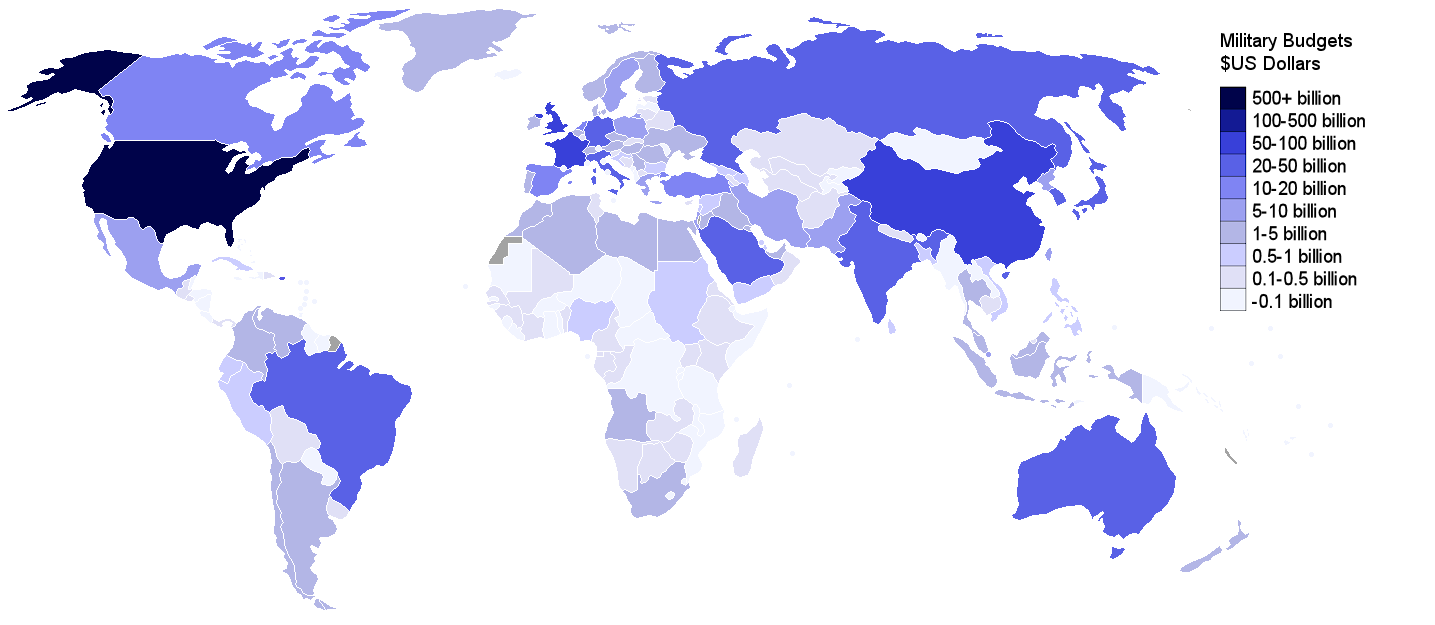
The world's top 7 largest military budgets in 2010. Figures sourced from SIPRI[1]  Military spending
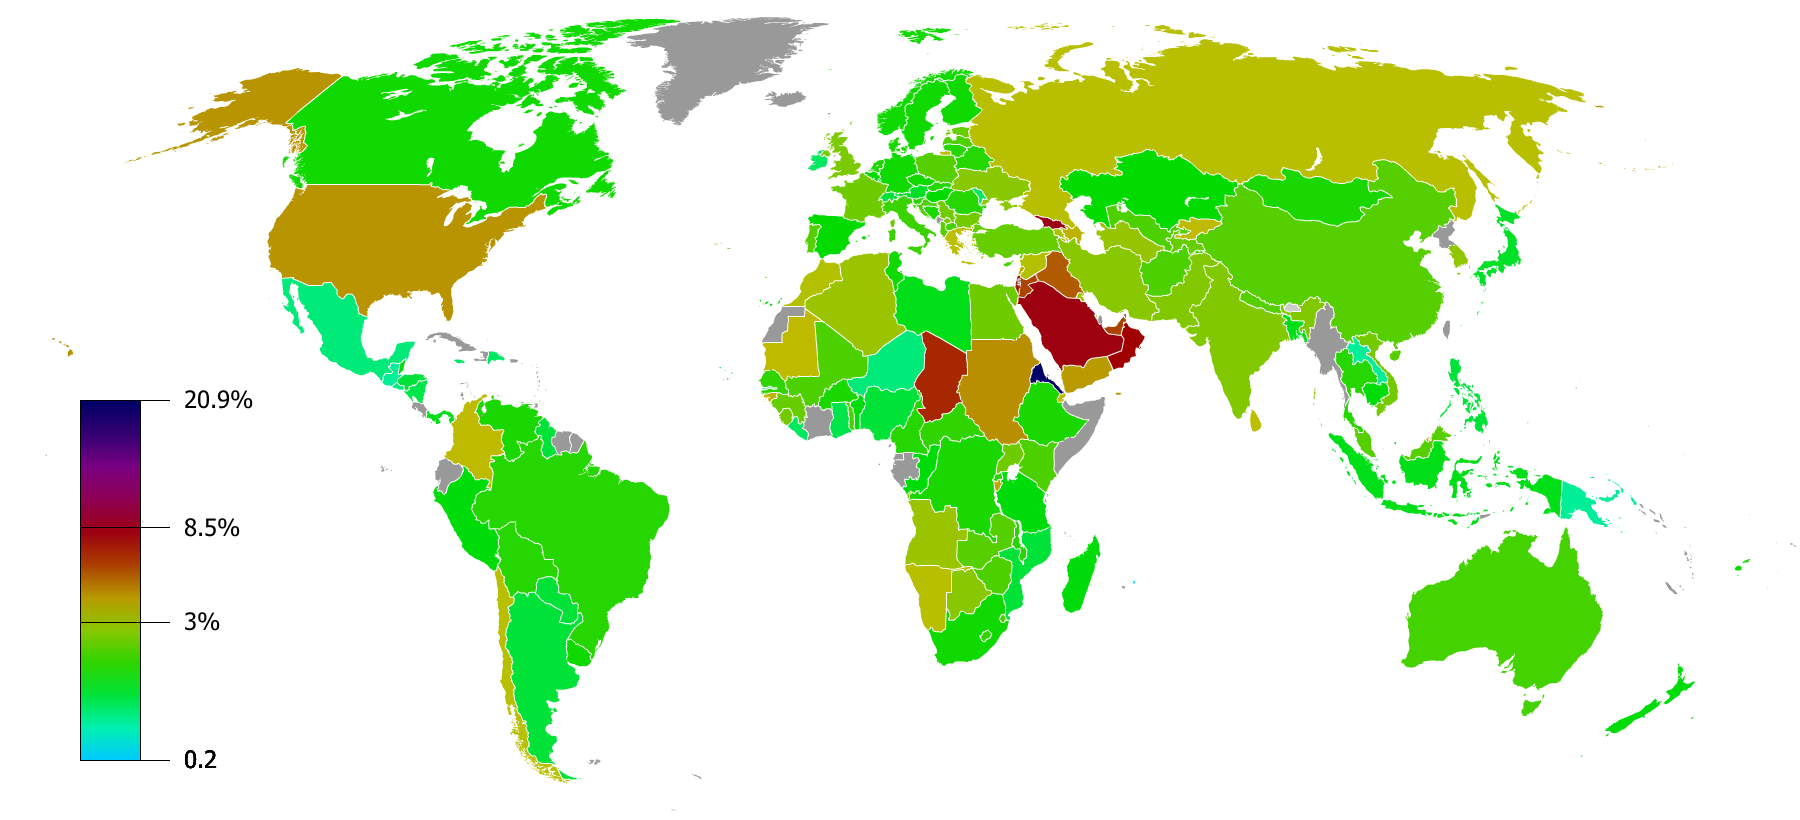
 Military spending as percentage of GDP
Rank Country Military expenditure, 2010[2] % of GDP, 2009 1 
United States 698,105,000,000 4.7% 2 
People's Republic of China 114,300,000,000 2.2% 3 
France 61,285,000,000 2.5% 4 
United Kingdom 57,424,000,000 2.7% 5 
Russia 52,586,000,000 4.3% 6 
Japan 51,420,000,000 1.0% 7 
Germany 46,848,000,000 1.4% 8 
Saudi Arabia 39,200,000,000 11.2% 9 
Italy 38,303,000,000 1.8% 10 
India 36,030,000,000 1.8% 11 
Brazil 27,120,000,000 1.6% 12 
Australia 26,900,000,000 1.9% 13 
South Korea 26,550,000,000 2.9% 14 
Spain 25,507,470,000 1.1% 15 
Canada 21,800,000,000 1.5% 16 
Israel 16,000,000,000 6.4% 17 
United Arab Emirates 15,749,000,000 7.3% 18 
Turkey 15,634,000,000 2.7% 19 
Netherlands 11,604,000,000 1.5% 20 
Poland 10,800,000,000 1.8% 21 
Greece 10,398,498,000 3.2% 22 
Singapore 9,829,496,000 4.3% 23 
Colombia 9,191,000,000 3.7% 24 
Iran 9,174,000,000 1.8% 25 
Republic of China (Taiwan) 8,535,000,000 2.4%[3] 26 
Egypt 7,150,000,000 2.1% 27 
Pakistan 6,410,000,000 2.8% 28 
Mexico 6,300,000,000 0.5% 29 
Norway 6,200,000,000 1.6% 30 
Algeria 6,000,000,000 3.8% 31 
Sweden 5,500,000,000 1.2% 32 
Thailand 5,200,000,000 1.9% 33 
Indonesia 4,740,000,000 0.9% 34 
Kuwait 4,700,000,000 4.4% 35 
Iraq 4,663,000,000 5.4% 36 
Belgium 4,544,000,000 1.2% 37 
Denmark 4,330,000,000 1.4% 38 
Austria 3,650,000,000 0.9% 39 
Oman 4,047,000,000 9.7% 40 
Switzerland 4,000,000,000 0.8% 41 
Venezuela 4,000,000,000 1.3% 42 
Portugal 3,825,843,000 2.1% 43 
Angola 3,774,000,000 4.2% 44 
Chile 3,620,000,000 3.5% 45 
South Africa 3,160,000,000 1.3% 46 
Finland 4,051,320,000 1.5% 47 
Ukraine 1,200,000,000 2.9% 48 
Malaysia 3,500,000,000 2.0% 49 
Morocco 3,256,000,000 3.4% 50 
Argentina 3,179,000,000 1.0% 51 
Czech Republic 2,529,000,000 1.4% 52 
Vietnam 2,410,000,000 2.5% 53 
Syria 1,800,000,000 4.0% 54 
Romania 2,164,000,000 1.4% 55 
Peru 1,992,000,000 1.4% 56 
Sudan 1,991,000,000c 3.4%c 57 
Nigeria 1,724,000,000 0.9% 58 
Lebanon 875,000,000 4.1% 59 
Philippines 2,439,510,000 0.8% 60 
Azerbaijan 1,421,000,000 3.4% 61 
Jordan 1,400,000,000 6.1% 62 
New Zealand 1,358,000,000 1.2% 63 
Ireland 1,354,000,000 0.6% 64 
Hungary 1,323,000,000 1.1% 65 
Sri Lanka 1,280,000,000 3.5% 66 
Kazakhstan 1,227,000,000 1.2% 67 
Yemen 1,222,000,000b 3.9%b 68 
Bangladesh 1,137,000,000 1.0% 69 
Libya 1,500,000,000b 1.2%b 70 
Croatia 1,060,000,000 1.8% 71 
Slovakia 1,010,000,000 1.4% 72 
Serbia 920,000,000 2.3% 73 
Slovenia 788,000,000 1.6% 74 
Bahrain 731,000,000 3.7% 75 
Belarus 726,000,000 1.4% 76 
Bulgaria 698,000,000 2.0% 77 
Kenya 594,000,000 2.0% 78 
Cyprus 550,000,000 1.8% 79 
Tunisia 548,000,000 1.3% 80 
Uruguay 491,000,000 1.6% 81 
Eritrea 469,000,000d 20.9%d 82 
Georgia 496,935,000 5.6% 83 
Lithuania 427,000,000 1.4% 84 
Armenia 404,000,000 4.2% 85 
Nepal 60,000,000 2.0% 86 
Cameroon 368,000,000 1.6% 87 
Côte d'Ivoire 353,000,000b 1.5% 88 
Botswana 352,000,000 3.0% 89 
Ethiopia 450,000,000 1.0% 90 
Estonia 336,000,000 2.3% 91 
Namibia 329,000,000 3.7% 92 
Brunei 327,000,000 3.1% 93 
Dominican Republic 322,000,000 0.7% 94 
Bolivia 314,000,000 2.0% 95 
Luxembourg 301,000,000a 0.6% 96 
Uganda 276,000,000 1.8% 97 
Latvia 268,000,000 1.4% 98 
Afghanistan 250,000,000j 1.8% 99 
Zambia 243,000,000 1.7% 100 
Chad 242,000,000 6.2% 101 
Honduras 235,000,000 1.5% 102 
Turkmenistan 233,000,000e 2.9%e 103 
Bosnia and Herzegovina 232,000,000 1.3% 104 
Tanzania 217,000,000j 1.1% 105 
Senegal 207,000,000 1.6% 106 
Albania 201,000,000 2.1% 107 
Cambodia 191,000,000j 1.1% 108 
Mali 183,000,000 1.9% 109 
Kyrgyzstan 167,000,000j 3.6% 110 
Congo, Democratic Republic of the 163,000,000 1.0% 111 
Guatemala 161,000,000 0.4% 112 
Panama 146,000,000e 1.0%e 113 
Paraguay 146,000,000 0.9% 114 
Republic of Macedonia 145,000,000 1.7% 115 
Burkina Faso 140,000,000 1.2% 116 
Congo, Republic of the 133,000,000 1.1%b 117 
El Salvador 133,000,000 0.7% 118 
Ghana 115,000,000 0.7% 119 
Mauritania 115,000,000j 3.8% 120 
Guinea 99,900,000f 2.2%f 121 
Zimbabwe 93,800,000 1.9%c 122 
Mozambique 92,500,000 0.8% 123 
Jamaica 80,300,000 0.6% 124 
Rwanda 72,700,000 1.5% 125 
Mongolia 71,000,000a 1.4%a 126 
Benin 67,700,000b 1.1% 127 
Tajikistan 63,400,000f 2.2%f 128 
Swaziland 60,000,000a 1.9%a 129 
Togo 57,000,000 1.9% 130 
Madagascar 55,700,000 0.8% 131 
Central African Republic 52,900,000 1.8% 132 
Uzbekistan 52,000,000d 1.9%d 133 
Malta 51,600,000 0.7% 134 
Niger 49,200,000 0.5%b 135 
Malawi 48,600,000a 1.2%a 136 
Fiji 48,400,000b 1.3% 137 
Burundi 46,900,000 3.8% 138 
Lesotho 45,600,000j 2.8%j 139 
Nicaragua 44,100,000 0.7% 140 
Sierra Leone 42,900,000b 2.4% 141 
Papua New Guinea 39,100,000 0.5% 142 
Djibouti 36,900,000b 3.7%b 143 
Moldova 19,000,000 0.5% 144 
Laos 18,400,000j 0.3% 145 
Guinea-Bissau 15,700,000g 2.1%g 146 
Belize 14,900,000 1.2% 147 
Mauritius 14,000,000b 0.2%b 148 
Iceland 9,900,000j 0.1% 149 
Cape Verde 8,800,000 0.5% 150 
Guyana 8,100,000h 0.8%h 151 
Liberia 7,200,000j 0.8% 152 
Seychelles 6,600,000 1.2% 153 
Gambia, The 4,600,000a 0.6%a 154 
North Korea Not reported na i - ^ Not updated since 2007.
- ^ Not updated since 2008.
- ^ Not updated since 2006.
- ^ Not updated since 2003.
- ^ Not updated since 1999.
- ^ Not updated since 2004.
- ^ Not updated since 2005.
- ^ Not updated since 1996.
- ^ No data available from SIPRI. Estimates from other sources claim about 25% of GDP, aprox. $6 Billion.[4]
- ^ Not updated since 2009.
SIPRI Yearbook 2010

The world's top 5 largest military budgets in graph.
(also permanent members of the United Nations Security Council)
Figures sourced from SIPRI.The following is a table of the top 15 countries with the highest military expenditure for 2009 published in the Stockholm International Peace Research Institute (SIPRI) Yearbook 2010 using current market exchange rates in current (2009) US dollars.[5]
Rank Country 2010 Spending ($ b.) Share of 2010 GDP (%) World Share (%) — World Total 1 630 2.6 100 1 United States698 4.8 42.8 2 Chinaa119 2.1 7.3 3 United Kingdom59.6 2.7 3.7 4 Russiaa58.7 4.0 3.6 5 Japan54.5 1.0 3.3 6 Germany45.2 1.3 2.8 7 Turkey46.6 5.3 3.1 8 France44 2.3 3.0 9 Saudi Arabiab45.2 10.4 2.8 9 India41.3 2.2 2.5 10 Italy37.0 1.8 2.3 11 Brazil33.5 1.6 2.1 12 South Korea27.6 2.8 1.7 13 Australia24.0 2.0 1.5 14 Canada22.8 1.5 1.4 - ^ SIPRI estimate
- ^ The figures for Saudi Arabia include expenditure for public order and safety and might be slight overestimates.
See also
- Arms industry
- List of countries by military expenditures per capita
- List of countries by level of military equipment
- List of countries by number of troops
- Military budget
- Military budget of the United States
- List of countries without armed forces
- Number of warships in service worldwide
- Military of the European Union
References
- ^ a b The SIPRI Military Expenditure Database
- ^ at constant prices and exchange rates (2008 US dollars)
- ^ http://milexdata.sipri.org/result.php4
- ^ http://www.state.gov/r/pa/ei/bgn/2792.htm
- ^ The 15 countries with the highest military expenditure in 2009
External links
Strength Finance Peacekeeping Global Peace Index · UN peacekeepersCategories:- Lists of countries
- Military lists
- Government finances
- Military economics
Wikimedia Foundation. 2010.