- Climate of the Los Angeles Basin
-
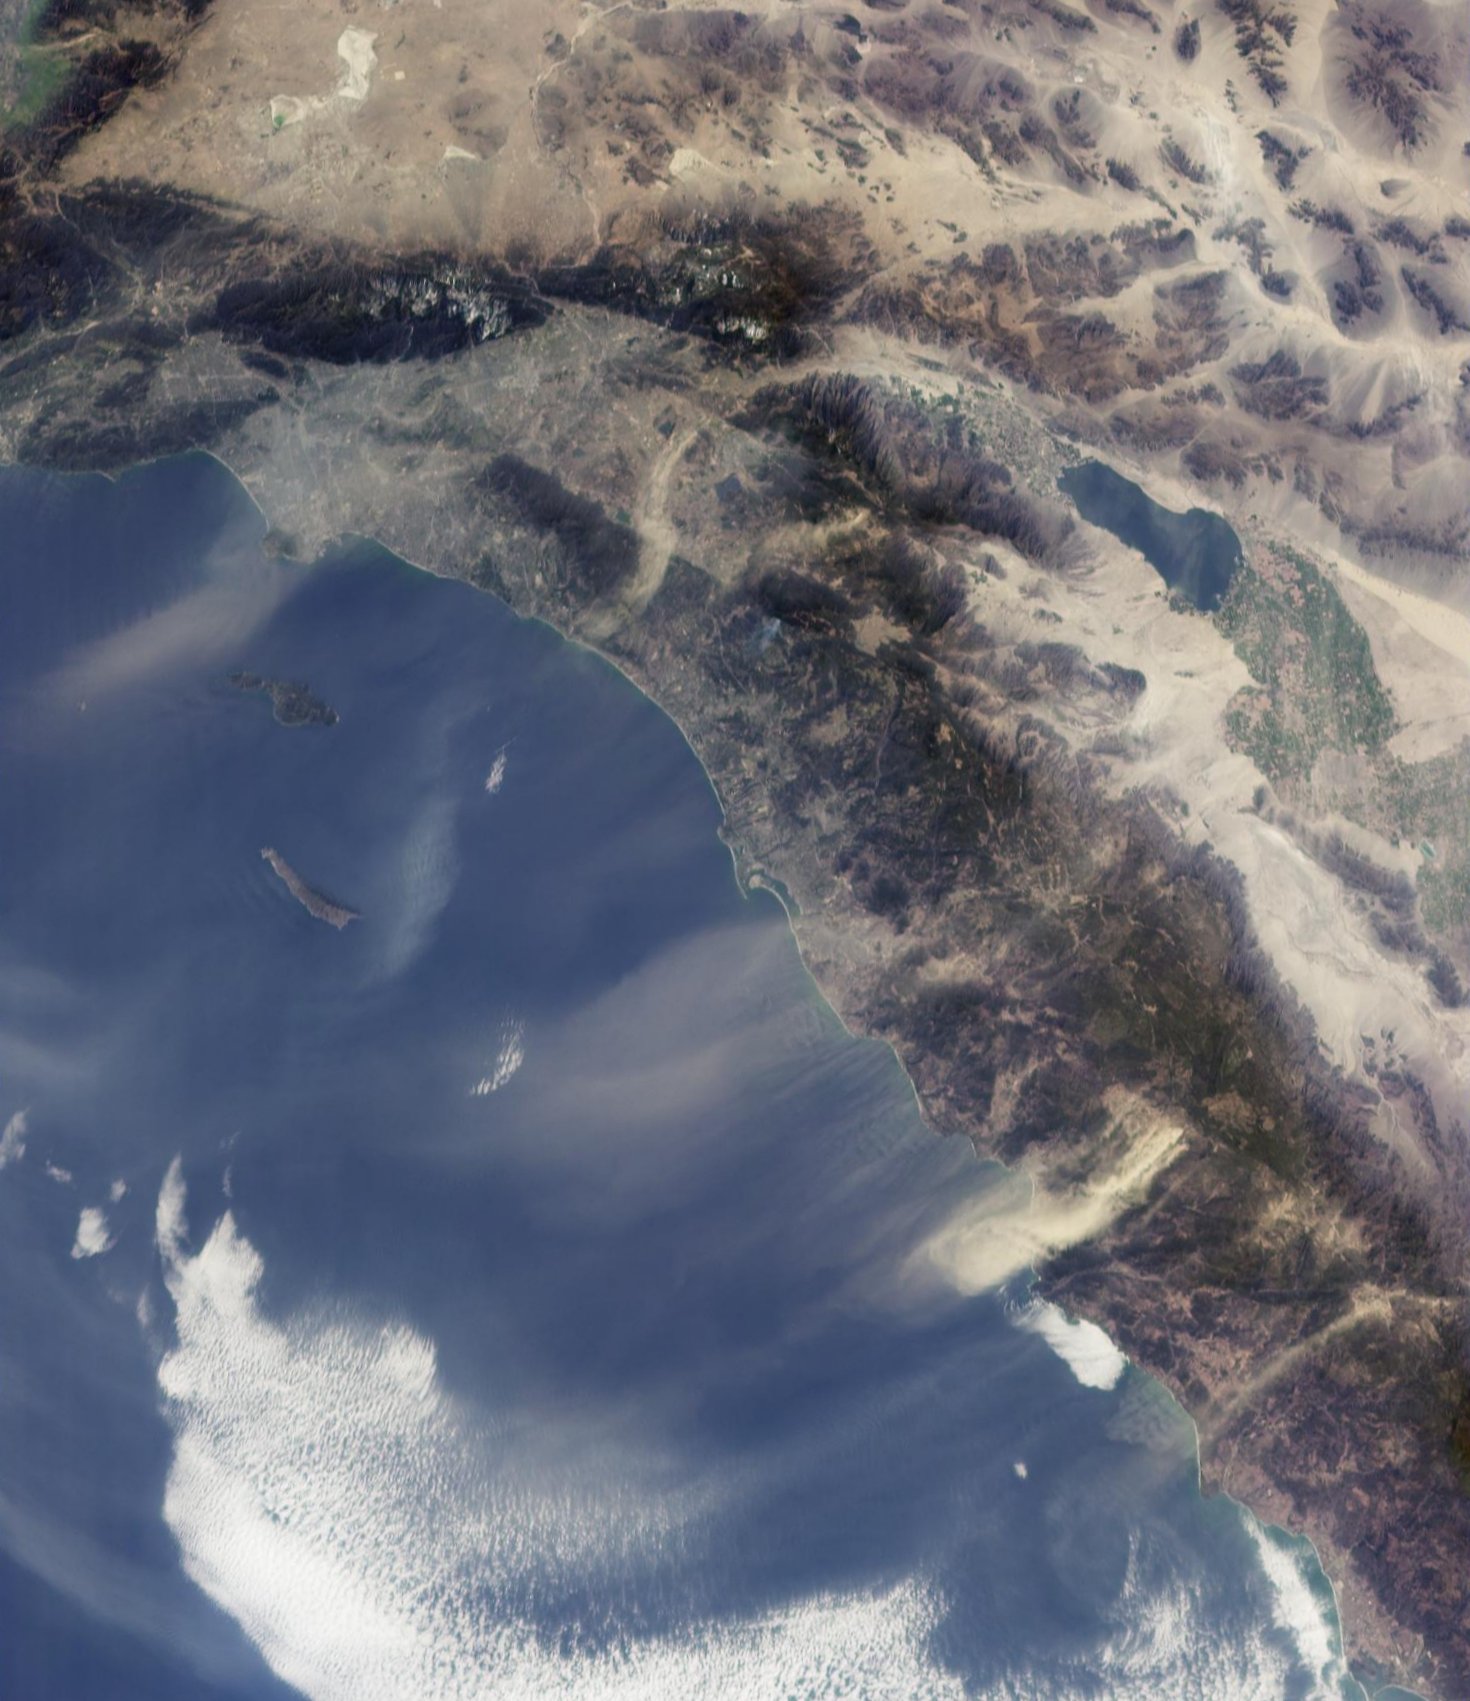
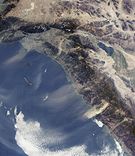 The Santa Ana winds in Southern California sweep from the deserts and across the Los Angeles Basin pushing smoke from wildfires far out into the Pacific Ocean.
The Los Angeles Basin is noted for its moderate weather. It is characterized by a Mediterranean climate or seasonal changes in rainfall——dry summer and rainy winter——but relatively modest transitions in temperature. Under the modified Köppen climate classification, the coast is classified as Csb and the inland areas as Csa.
Summers are warm to hot and dry with an average August high/low at LAX of 76.6 °F (24.8 °C) and 64.2 °F (17.9 °C). The same figures at the University of Southern California downtown campus are 84.8 °F (29.3 °C) and 65.6 °F (18.7 °C). However temperatures sometimes exceed 90 °F (32 °C) during the summer. Winters are mild and somewhat rainy with high temperatures at LAX of 65.5 °F (18.6 °C) and lows of 47.8 °F (8.8 °C). Spring and autumn bring mild days with cool evenings and are generally dry.
The Los Angeles area is also subject to the phenomena typical of a microclimate. As such, the daytime temperatures can vary as much as 36 °F (20 °C) between inland areas and the coast.
Most of the rainfall occurs during winter and spring (February is considered the wettest month). Sometimes rainfall can occur in the summer from monsoon thunderstorms, but this is unusual. Los Angeles averages 15.1 inches (384 mm) of precipitation per year, but is lower at the coast and higher at the mountains. Tornadoes are rare, however, weak-to-moderate-strength waterspouts sometimes occur during warm winter storms, although this is unusual. Snow is extremely rare in the Los Angeles basin, but the nearby San Gabriel Mountains typically receive snow every winter season. The greatest snowfall recorded in downtown Los Angeles was 2 inches (5 cm) on January 15, 1932.[1][2]
Contents
Overview
Climate data for Los Angeles (Downtown - USC campus) Month Jan Feb Mar Apr May Jun Jul Aug Sep Oct Nov Dec Year Average high °F (°C) 68.1
(20.1)69.6
(20.9)69.8
(21.0)73.1
(22.8)74.5
(23.6)79.5
(26.4)83.8
(28.8)84.8
(29.3)83.3
(28.5)79.0
(26.1)73.2
(22.9)68.7
(20.4)75.6 Daily mean °F (°C) 58.3
(14.6)60.0
(15.6)60.7
(15.9)63.8
(17.7)66.2
(19.0)70.5
(21.4)74.2
(23.4)75.2
(24.0)74.0
(23.3)69.5
(20.8)62.9
(17.2)58.5
(14.7)66.2 Average low °F (°C) 48.5
(9.2)50.3
(10.2)51.6
(10.9)54.4
(12.4)57.9
(14.4)61.4
(16.3)64.6
(18.1)65.6
(18.7)64.6
(18.1)59.9
(15.5)52.6
(11.4)48.3
(9.1)56.6 Rainfall inches (mm) 3.33
(84.6)3.68
(93.5)3.14
(79.8)0.83
(21.1)0.31
(7.9)0.06
(1.5)0.01
(0.3)0.13
(3.3)0.32
(8.1)0.37
(9.4)1.05
(26.7)1.91
(48.5)15.14
(384.6)Avg. rainy days (≥ 0.01 inch) 6.5 6.0 6.4 3.0 1.3 0.6 0.3 0.5 1.2 2.0 3.1 4.3 35.2 Sunshine hours 225.3 222.5 267.0 303.5 276.2 275.8 364.1 349.5 278.5 255.1 217.3 219.4 3,254.2 Source: NOAA[3] Climate data for Los Angeles (LAX, near sea) Month Jan Feb Mar Apr May Jun Jul Aug Sep Oct Nov Dec Year Average high °F (°C) 65.6
(18.7)65.8
(18.8)65.3
(18.5)68.0
(20.0)69.3
(20.7)72.6
(22.6)75.3
(24.1)76.8
(24.9)76.5
(24.7)74.3
(23.5)70.4
(21.3)66.7
(19.3)70.6 Daily mean °F (°C) 57.1
(13.9)58.0
(14.4)58.3
(14.6)60.8
(16.0)63.1
(17.3)66.4
(19.1)69.3
(20.7)70.7
(21.5)70.1
(21.2)66.9
(19.4)61.6
(16.4)57.6
(14.2)63.3 Average low °F (°C) 48.6
(9.2)50.1
(10.1)51.3
(10.7)53.6
(12.0)56.9
(13.8)60.1
(15.6)63.3
(17.4)64.5
(18.1)63.6
(17.6)59.4
(15.2)52.7
(11.5)48.5
(9.2)56.1 Rainfall inches (mm) 2.98
(75.7)3.11
(79)2.40
(61)0.63
(16)0.24
(6.1)0.08
(2)0.03
(0.8)0.14
(3.6)0.26
(6.6)0.36
(9.1)1.13
(28.7)1.79
(45.5)13.15
(334)Avg. rainy days 6.4 6.3 6.5 2.6 1.3 0.5 0.4 0.5 1.2 2.0 3.1 4.7 35.5 Source: NOAA [4] Climate data for Long Beach, California (Long Beach Airport) Month Jan Feb Mar Apr May Jun Jul Aug Sep Oct Nov Dec Year Average high °F (°C) 68.0
(20.0)68.5
(20.3)68.9
(20.5)72.7
(22.6)74.0
(23.3)78.3
(25.7)82.9
(28.3)84.6
(29.2)83.1
(28.4)78.9
(26.1)73.4
(23.0)68.8
(20.4)75.2 Daily mean °F (°C) 57.0
(13.9)58.3
(14.6)59.7
(15.4)63.0
(17.2)65.9
(18.8)69.8
(21.0)73.8
(23.2)75.1
(23.9)73.4
(23.0)68.6
(20.3)61.8
(16.6)57.1
(13.9)65.3 Average low °F (°C) 46.0
(7.8)48.1
(8.9)50.4
(10.2)53.2
(11.8)57.8
(14.3)61.3
(16.3)64.6
(18.1)65.6
(18.7)63.7
(17.6)58.3
(14.6)50.1
(10.1)45.3
(7.4)55.4 Rainfall inches (mm) 2.95
(74.9)3.01
(76.5)2.43
(61.7)0.60
(15.2)0.23
(5.8)0.08
(2)0.02
(0.5)0.10
(2.5)0.24
(6.1)0.40
(10.2)1.12
(28.4)1.76
(44.7)12.94
(328.7)Avg. rainy days 6.5 6.3 6.3 3.2 1.3 0.5 0.4 0.5 1.1 2.1 3.2 4.7 36.1 Source: NOAA [3] Climate data for Santa Ana, California Month Jan Feb Mar Apr May Jun Jul Aug Sep Oct Nov Dec Year Average high °F (°C) 69
(21)70
(21)71
(22)74
(23)75
(24)79
(26)83
(28)84
(29)83
(28)80
(27)74
(23)70
(21)75.9 Average low °F (°C) 47
(8)48
(9)50
(10)52
(11)56
(13)60
(16)63
(17)64
(18)63
(17)58
(14)51
(11)46
(8)54.8 Precipitation inches (mm) 3.19
(81)3.03
(77)2.8
(71)0.67
(17)0.24
(6.1)0.12
(3)0.04
(1)0.12
(3)0.35
(8.9)0.35
(8.9)1.18
(30)1.77
(45)13.9
(353)Source: U.S. Climate Data[5] Climate data for Anaheim, California Month Jan Feb Mar Apr May Jun Jul Aug Sep Oct Nov Dec Year Average high °F (°C) 69
(21)69
(21)70
(21)73
(23)75
(24)79
(26)84
(29)86
(30)85
(29)80
(27)74
(23)70
(21)76 Average low °F (°C) 45
(7)47
(8)48
(9)51
(11)56
(13)60
(16)62
(17)63
(17)62
(17)56
(13)51
(11)46
(8)54 Precipitation inches (mm) 2.4
(61)2.8
(71)2.5
(64)0.6
(15)0.1
(3)0.1
(3)0.0
(0)0.0
(0)0.1
(3)0.2
(5)0.8
(20)1.3
(33)11.3
(287)Source: U.S. Climate Data[5] Climate data for Culver City, California Month Jan Feb Mar Apr May Jun Jul Aug Sep Oct Nov Dec Year Average high °F (°C) 67.3
(19.6)68.6
(20.3)69.3
(20.7)72.6
(22.6)73.5
(23.1)77.1
(25.1)80.0
(26.7)81.1
(27.3)80.2
(26.8)77.0
(25.0)71.6
(22.0)67.7
(19.8)73.8 Daily mean °F (°C) 56.7
(13.7)57.9
(14.4)59.2
(15.1)62.3
(16.8)64.6
(18.1)68.0
(20.0)70.8
(21.6)71.7
(22.1)70.8
(21.6)67.1
(19.5)61.2
(16.2)57.0
(13.9)63.9 Average low °F (°C) 46.1
(7.8)47.2
(8.4)49.1
(9.5)52.0
(11.1)55.7
(13.2)58.8
(14.9)61.5
(16.4)62.2
(16.8)61.3
(16.3)57.2
(14.0)50.8
(10.4)46.3
(7.9)54.0 Rainfall inches (mm) 3.19
(81)3.25
(82.6)2.66
(67.6)0.58
(14.7)0.26
(6.6)0.04
(1)0.02
(0.5)0.07
(1.8)0.08
(2)0.33
(8.4)0.94
(23.9)1.90
(48.3)13.32
(338.3)Avg. rainy days (≥ 0.01 inch) 5.7 5.3 5.8 1.7 0.7 0.2 0.3 0.2 0.6 1.1 1.9 4.0 27.5 Source: NOAA[6] Climate data for Santa Monica Pier, California (on the beach) Month Jan Feb Mar Apr May Jun Jul Aug Sep Oct Nov Dec Year Average high °F (°C) 63.7
(17.6)63.4
(17.4)62.1
(16.7)63.4
(17.4)63.6
(17.6)65.9
(18.8)68.8
(20.4)70.3
(21.3)70.5
(21.4)69.6
(20.9)67.3
(19.6)64.8
(18.2)66.1 Average low °F (°C) 50.2
(10.1)51.3
(10.7)52.1
(11.2)53.9
(12.2)56.5
(13.6)59.4
(15.2)62.1
(16.7)63.1
(17.3)62.6
(17.0)59.4
(15.2)54.3
(12.4)50.5
(10.3)56.3 Precipitation inches (mm) 3.06
(77.7)3.29
(83.6)2.56
(65)0.53
(13.5)0.25
(6.4)0.04
(1)0.01
(0.3)0.13
(3.3)0.17
(4.3)0.36
(9.1)1.02
(25.9)1.85
(47)13.27
(337.1)Avg. rainy days 6.0 5.9 5.1 2.4 1.0 0.4 0.2 0.5 1.0 1.8 2.5 4.0 30.8 Source: NOAA [7] Santa Ana Winds
Main article: Santa Ana windsThe Santa Ana winds are strong, extremely dry offshore winds that characteristically sweeps across Southern California and northern Baja California during late fall into winter season. They range from hot to cold, depending on the prevailing temperatures in the source region, the Great Basin and upper Mojave Desert. Nevertheless, the winds are notorious for causing hot, dry weather due to compressional heating of the lower atmosphere.
Extreme Weather
In downtown Los Angeles, weather records began on July 1, 1877. The highest temperature recorded in downtown Los Angeles was 113 °F (45 °C) on September 27, 2010. The lowest temperature was 28 °F (−2 °C) on January 7, 1913 and on January 4, 1949.[8] The wettest year was 2005 with 37.25 inches and the driest year was 2007 with 3.21 inches. The greatest rainfall in one month was 14.94 inches in January 1969. The greatest rainfall in 24 hours was 5.68 inches on March 2, 1938.[9]
At the Los Angeles International Airport, the highest recorded temperature was 110 °F (43 °C) on September 26, 1963. The lowest temperature was 27 °F (−3 °C) on January 4, 1949. The wettest year was 1983 with 29.46 inches (748 mm) and the driest year was 1947 with 2.95 inches (74.9 mm). The greatest rainfall in one month was 13.79 inches (350 mm) in February 1998. The greatest rainfall in 24 hours was 5.60 inches (142.2 mm) on November 21, 1967.[10]
In Long Beach, the highest recorded temperature was 111 °F (44 °C) on October 16, 1958, and October 15, 1961, and again on September 27, 2010. The lowest temperature was 21 °F (−6 °C) on January 20, 1922. The wettest year was 1978 with 27.67 inches (703 mm). The driest year was 2002 with 2.63 inches (66.8 mm). The greatest rainfall in one month was 14.50 inches (368 mm) in January 1969, including a record 24-hour rainfall of 6.71 inches (170.4 mm) on January 20 that month. The record snowfall was 1.5 inches (3.8 cm) in January 1949.[11]
References
- ^ Rasmussen, Cecilia (2005-03-10). "We're Not in Kansas, but We Do Get Twisters - Los Angeles Times". Articles.latimes.com. http://articles.latimes.com/2005/mar/10/local/me-surroundings10. Retrieved 2009-01-08.
- ^ Burt, Christopher. Extreme Weather: A Guide and Record Book. New York: Norton, 2004: 100.
- ^ a b "Climatography of the United States No. 20 (1971–2000) - Los Angeles Downtown USC, CA" (PDF). National Oceanic and Atmospheric Administration. 2004. http://cdo.ncdc.noaa.gov/climatenormals/clim20/ca/045115.pdf. Retrieved 6 October 2011.
- ^ "Climatography of the United States No. 20 (1971–2000) - Los Angeles Intl AP, CA" (PDF). National Oceanic and Atmospheric Administration. 2004. http://cdo.ncdc.noaa.gov/climatenormals/clim20/ca/045114.pdf. Retrieved 2010-05-31.
- ^ a b "Monthly averages for Santa Ana, California". http://www.usclimatedata.com/climate.php?location=USCA1016. Retrieved February 27, 2009.
- ^ "Climatography of the United States No. 20 (1971–2000) - Culver City, CA" (PDF). National Oceanic and Atmospheric Administration. 2004. http://cdo.ncdc.noaa.gov/climatenormals/clim20/ca/042214.pdf. Retrieved 2010-07-25.
- ^ "NCDC: U.S. Climate Normals". National Oceanic and Atmospheric Administration. http://cdo.ncdc.noaa.gov/climatenormals/clim20/ca/047953.pdf.
- ^ http://climexp.knmi.nl/data/mgdcnUSC00045115.dat
- ^ http://www.wrcc.dri.edu/cgi-bin/cliMAIN.pl?ca5115
- ^ http://www.wrcc.dri.edu/cgi-bin/cliMAIN.pl?ca5114
- ^ http://www.wrcc.dri.edu/cgi-bin/cliMAIN.pl?ca5082; http://www.wrcc.dri.edu/cgi-bin/cliMAIN.pl?ca5085
Categories:- Environment of Los Angeles, California
- Climate by city
- Los Angeles metropolitan area
- Greater Los Angeles Area
- Climate of California
- Southern California
Wikimedia Foundation. 2010.