- Oxford City Council election, 2008
-
Elections for Oxford City Council were held on Thursday 1 May 2008. As Oxford City Council is elected by halves, one seat in each of the 24 wards is up for election.
Overall turnout was 32.6%, down from 35.8% in 2006. The lowest turnout (20.8%) was in St Mary's ward and the highest (46.1%) in Marston.
Results
Oxford Local Election Result 2008 Party Seats Gains Losses Net gain/loss Seats % Votes % Votes +/- Labour 12 4 0 +4 50.0 34.6 11,882 +4.5 Liberal Democrat 8 2 1 +1 33.3 22.8 7,857 −8.6 Green 3 0 1 −1 12.5 16.9 5,824 −3.9 Independent Working Class 1 0 2 −2 4.2 3.9 1,329 −0.1 Conservative 0 0 2 −2 0 20.2 6,960 +8.2 Independent 0 0 0 0 0 1.6 537 +0.5 Note: three Independents stood in 2008, compared with two in 2006.
This result has the following consequences for the total number of seats on the Council after the elections:
Party Previous council Staying councillors Seats up for election Election result New council Labour 19 11 8 12 23 Liberal Democrats 15 8 7 8 16 Green 8 4 4 3 7 Independent Working Class 4 1 3 1 2 Conservatives 2 0 2 0 0 Independent 0 0 0 0 0 Total 48 24 24 24 48 Results by ward
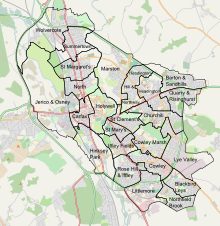 Map of the Oxford Wards
Barton and Sandhills
Party Candidate Votes % ±% Liberal Democrat Patrick Murray 528 34.3 −5.5 Labour Andrew Lomas 524 34.0 −0.6 Conservative Timothy Hamer 406 26.4 +11.9 Green Raymond Hitchins 82 5.3 +0.4 Turnout 1546 32.1 −3.3 Liberal Democrat hold Swing Blackbird Leys
Party Candidate Votes % ±% Labour Val Smith 647 54.3 +5.9 Independent Working Class Lee Cole 417 35.0 −8.4 Conservative Gareth Jennings 79 6.6 +6.6 Green Sue Tibbles 28 2.4 0.0 Liberal Democrat Ian Bearder 20 1.7 −4.1 Turnout 1192 29.5 −0.2 Labour gain from Independent Working Class Swing Carfax
Party Candidate Votes % ±% Liberal Democrat Stephen Brown 375 35.7 +5.4 Conservative Paul Sargent 284 27.1 +4.6 Green Claudia Fitzherbert 208 19.8 −12.8 Labour Sarah Hutchinson 182 17.3 +2.7 Turnout 1059 24.5 -0.4 Liberal Democrat gain from Conservative Swing Note that Paul Sargent won the Carfax seat in the 2004 elections for the Liberal Democrats, but crossed the floor to the Conservatives in 2007. So when comparing to the 2004 elections, the Liberal Democrats hold.
Churchill
Party Candidate Votes % ±% Labour Mark Lygo 588 41.7 –4.7 Independent Working Class Claire Kent 375 26.6 +3.5 Liberal Democrat Peter Bonney 227 16.1 +4.4 Conservative Gordon Bell 172 12.2 –0.1 Green Eliza Hilton 47 3.3 –3.3 Turnout 1412 30.9 +2.7 Labour gain from Independent Working Class Swing Cowley
Party Candidate Votes % ±% Labour Bryan Keen 692 48.2 +16.2 Conservative Judith Harley 250 17.4 +17.4 Liberal Democrat Susan Gonzalez 224 15.6 −22.0 Green Alyson Duckmanton 180 12.5 -5.1 Independent Paul Garraway 91 6.3 N/A Turnout 1440 32.9 −6.2 Labour hold Swing Cowley Marsh
Party Candidate Votes % ±% Labour Saj Malik 773 51.4 +13.6 Liberal Democrat Tony Brett 447 29.7 −0.1 Green Lilian Sherwood 153 10.2 −8.3 Conservative Martin Young 131 8.7 −5.2 Turnout 1512 33.8 +5.6 Labour hold Swing Note that Saj Malik won the Cowley Marsh seat in the 2004 elections for the Liberal Democrats, but crossed the floor to Labour in 2007. So when comparing to the 2004 elections, Labour gain from the Liberal Democrats.
Headington
Party Candidate Votes % ±% Liberal Democrat Ruth Wilkinson 564 35.4 −23.4 Conservative Chris Clifford 548 34.4 +16.7 Labour Van Coulter 266 16.7 +3.3 Green Jill Haas 215 13.5 +3.4 Turnout 1598 39.6 +1.3 Liberal Democrat hold Swing Headington Hill and Northway
Party Candidate Votes % ±% Labour Maureen Christian 485 36.3 +5.7 Conservative Marc Borja 448 33.6 +7.3 Liberal Democrat Jock Coats 320 24.0 −10.3 Green Mary Livingstone 82 6.1 −2.7 Turnout 1340 31.2 −4.0 Labour hold Swing Hinksey Park
Party Candidate Votes % ±% Labour Oscar Van Nooijen 871 52.2 +6.6 Green Deborah Glass Woodin 391 23.4 −6.0 Conservative Simon Mort 222 13.3 +2.9 Liberal Democrat Joe Chick 185 11.1 −3.5 Turnout 1666 36.0 −5.0 Labour hold Swing Note: ±% figures are calculated with respect to the results of the by-election of 27 July 2006.
Holywell
Party Candidate Votes % ±% Liberal Democrat Nathan Pyle 481 45.4 −3.3 Conservative Alex Stafford 239 22.5 +8.2 Green Chip Sherwood 196 18.5 −5.4 Labour Kieran Hutchinson Dean 144 13.6 +0.5 Turnout 1072 26.9 −2.3 Liberal Democrat gain from Green Swing Iffley Fields
Party Candidate Votes % ±% Green Elise Benjamin 858 54.7 Labour Mike Rowley 447 28.5 Conservative Nick Carter 159 10.1 Turnout 1568 38.6 -1.5 Green hold Swing Jericho and Osney
Party Candidate Votes % ±% Labour Colin Cook 907 53.2 Liberal Democrat Adrian Rosser 301 17.6 Green Sandhya Drew 282 16.5 Conservative Alexander Penny 216 12.7 Turnout 1706 Labour hold Swing Littlemore
Party Candidate Votes % ±% Labour John Tanner 639 50.7 Conservative Yvonne Lowe 313 24.8 Green Fionn Stevenson 173 13.7 Liberal Democrat Neil Fawcett 136 10.8 Turnout 1261 Labour hold Swing Lye Valley
Party Candidate Votes % ±% Labour Bob Timbs 741 60.0 +7.2 Conservative John Lowe 258 20.9 +10.8 Green John Kentish 126 10.2 +5.9 Liberal Democrat Dave White 110 8.9 −23.9 Turnout 1235 Labour hold Swing Note: ±% figures are calculated with respect to the results of the by-election of 21 September 2006.
Marston
Party Candidate Votes % ±% Labour Beverley Hazell 732 34.5 Liberal Democrat Caroline van Zyl 544 25.6 Independent Michael Haines 437 20.6 Conservative Duncan Hatfield 302 14.2 Green Alistair Morris 108 5.1 Turnout 2123 Labour gain from Liberal Democrat Swing North
Party Candidate Votes % ±% Liberal Democrat Clark Brundin 463 37.2 Conservative Frances Kennett 378 30.3 Green Merlyn Lyons 221 17.7 Labour Sue Ledwith 184 14.8 Turnout 1246 Liberal Democrat hold Swing Northfield Brook
Party Candidate Votes % ±% Independent Working Class Stuart Craft 537 45.3 Labour Richard Stevens 471 39.7 Conservative Mary Jones 78 6.6 Liberal Democrat Beatrice Morlin 56 4.7 Green Kate Prendergast 44 3.7 Turnout 1186 Independent Working Class hold Swing Quarry and Risinghurst
Party Candidate Votes % ±% Labour Laurence Baxter 786 37.6 Conservative Tia MacGregor 622 29.8 Liberal Democrat Roz Smith 585 28.0 Green Donald O'Neal 86 4.1 Independent Pat Mylvaganam 9 0.4 Turnout 2088 Labour gain from Conservative Swing Note that Tia MacGregor won the Quarry and Risinghurst seat in the 2004 elections for the Liberal Democrats, but crossed the floor to the Conservatives in 2007. So when comparing to the 2004 elections, Labour gain from the Liberal Democrats.
Rose Hill and Iffley
Party Candidate Votes % ±% Labour Edward Turner 751 54.8 Conservative Siddo Deva 230 16.8 Liberal Democrat Catherine Bearder 207 15.1 Green Larry Sanders 182 13.3 Turnout 1370 Labour hold Swing St Clement's
Party Candidate Votes % ±% Green Nuala Young 558 48.6 Labour Altaf Hussain 280 24.4 Liberal Democrat Matthew Dieppe 158 13.8 Conservative Elizabeth Mills 152 13.2 Turnout 1148 Green hold Swing St Margaret's
Party Candidate Votes % ±% Liberal Democrat Gwynneth Royce 469 33.4 −16.6 Green Chris Goodall 390 27.8 0.0 Conservative Vernon Porter 378 26.9 +10.1 Labour James Fry 168 12.0 +6.6 Turnout 1407 32.6 −10.3 Liberal Democrat hold Swing St Mary's
Party Candidate Votes % ±% Green Matt Morton 488 57.1 Labour David Green 180 21.1 Conservative Carolyn Ten Holder 99 11.6 Liberal Democrat Julia Goddard 87 10.2 Turnout 854 Green hold Swing Summertown
Party Candidate Votes % ±% Liberal Democrat Stuart McCready 747 44.2 +1.9 Conservative Clara Bantry White 424 25.1 +4.5 Green Sarah Pethybridge 349 20.7 −8.9 Labour Scott Seamons 169 10.0 +2.5 Turnout 1699 35.5 −5.7 Liberal Democrat hold Swing Wolvercote
Party Candidate Votes % ±% Liberal Democrat Michael Gotch 623 34.1 −11.3 Conservative Joanne Bowlt 572 31.3 +7.7 Green Mary Franklin 377 20.6 −3.2 Labour Michael Taylor 255 14 +6.8 Turnout 1831 40.3 −4.7 Liberal Democrat hold Swing 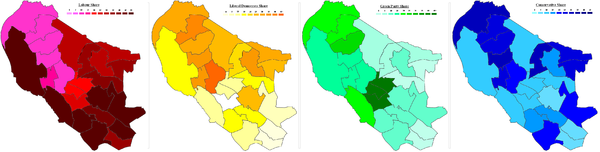
Sources
- Election results, from Oxford City Council
See also
Preceded by
Oxford City Council election, 2006Oxford Council elections Succeeded by
Oxford City Council election, 2010(2007 ←) United Kingdom local elections, 2008 (→ 2009) Metropolitan borough elections Barnsley · Birmingham · Bolton · Bradford · Bury · Calderdale · Coventry · Doncaster · Dudley · Gateshead · Kirklees · Knowsley · Leeds · Liverpool · Manchester · Newcastle upon Tyne · North Tyneside · Oldham · Rochdale · Rotherham · Salford · Sandwell · Sefton · Sheffield · Solihull · South Tyneside · St Helens · Stockport · Sunderland · Tameside · Trafford · Wakefield · Walsall · Wigan · Wirral · Wolverhampton
Unitary authorities Blackburn with Darwen · Cheshire East · Cheshire West and Chester · Derby · Durham · Halton · Hartlepool · Kingston upon Hull · Milton Keynes · North East Lincolnshire · Northumberland · Peterborough · Plymouth · Portsmouth · Reading · Slough · Southampton · Southend-on-Sea · Stoke-on-Trent · Swindon · Thurrock · Warrington · WokinghamDistrict councils Adur · Amber Valley · Barrow-in-Furness · Basildon · Basingstoke and Deane · Bassetlaw · Brentwood · Broxbourne · Burnley · Cambridge · Cannock Chase · Carlisle · Castle Point · Cheltenham · Cherwell · Chorley · Colchester · Craven · Crawley · Daventry · Eastleigh · Elmbridge · Epping Forest · Exeter · Fareham · Gloucester · Gosport · Great Yarmouth · Harlow · Harrogate · Hart · Hastings · Havant · Hertsmere · Huntingdonshire · Hyndburn · Ipswich · Lincoln · Maidstone · Newcastle-under-Lyme · North Hertfordshire · Norwich · Nuneaton and Bedworth · Oxford · Pendle · Preston · Purbeck · Redditch · Reigate and Banstead · Rochford · Rossendale · Rugby · Runnymede · Rushmoor · South Cambridgeshire · South Lakeland · St Albans · Stevenage · Stratford-on-Avon · Stroud · Swale · Tamworth · Tandridge · Three Rivers · Tunbridge Wells · Watford · Waveney · Welwyn Hatfield · West Lancashire · West Lindsey · West Oxfordshire · Weymouth and Portland · Winchester · Woking · Worcester · Worthing · Wyre ForestWelsh councils Blaenau Gwent · Bridgend · Caerphilly · Cardiff · Carmarthenshire · Ceredigion · Conwy · Denbighshire · Flintshire · Gwynedd · Isle of Anglesey · Merthyr Tydfil · Monmouthshire · Neath Port Talbot · Newport · Pembrokeshire · Powys · Rhondda Cynon Taff · Swansea · Torfaen · Vale of Glamorgan · WrexhamCategories:- Council elections in Oxford
- English local elections, 2008


Wikimedia Foundation. 2010.