- Cheltenham Council election, 2008
-
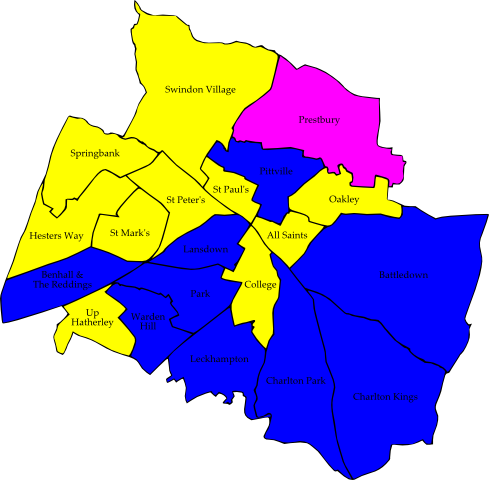
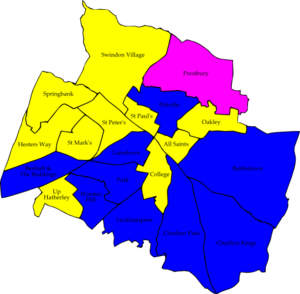 Map of the results of the 2008 Cheltenham council election. Liberal Democrat in yellow, Conservatives in blue and People Against Bureaucracy in pink.
The 2008 Cheltenham Council election took place on 1 May 2008 to elect members of Cheltenham Borough Council in Gloucestershire, England. Half of the council was up for election and the council stayed under no overall control.[1]
After the election, the composition of the council was
- Liberal Democrat 20
- Conservative 17
- People Against Bureaucracy 3[2]
Contents
Campaign
Before the election the Conservatives and Liberal Democrats had 17 seats each, People Against Bureaucracy 5 and Labour 1 seat, with the Conservatives forming the administration.[3] 20 seats were being contested with both Conservatives and Liberal Democrats contesting all of the seats, while Labour contested 9, Greens 4 and People Against Bureaucracy 3 seats.[3] The only Labour councillor Diana Hale stood down at the election, along with 2 Conservative and 1 People Against Bureaucracy councillors, while Liberal Democrat councillor Chris Coleman contested Leckhampton instead of his existing seat in St Paul's ward.[3]
During the campaign the national Conservative leader David Cameron briefly visited Cheltenham to campaign, raising the issues of post offices being closed, garden grabbing, preserving local shops and house building on flood plains.[4][5]
Election result
The results saw the Liberal Democrats become the largest party on the council with 20 of the 40 seats after making 3 gains.[6][7] The Liberal Democrats held vulnerable seats in All Saints and St Peters wards, while making gains from each of the other 3 groups which had been defending seats.[8] They also almost defeated the Conservative leader of the council Duncan Smith who held on by 33 votes in Charlton Kings ward.[8]
The Conservatives stayed on 17 seats,[7] while the People Against Bureaucracy group lost 2 seats to have 3 councillors.[8] Labour was wiped out after losing their last seat[7] in Oakley, with the party only coming in third place in the ward.[9] Overall turnout in the election was 35.1%.[8]
As a result of the election the Liberal Democrats took over control of the administration of the council from the Conservatives.[10] The change in control came in a vote with the Liberal Democrat leader Steve Jordan receiving 18 votes, compared to 19 abstentions and the remaining 3 councillors being absent.[11]
Cheltenham Local Election Result 2008[12][13] Party Seats Gains Losses Net gain/loss Seats % Votes % Votes +/- Liberal Democrat 10 3 0 +3 50.0 44.9 14,059 +4.1% Conservative 9 1 1 0 45.0 45.8 14,342 -0.1% People Against Bureaucracy Action Group 1 0 2 -2 5.0 5.7 1,783 -2.6% Labour 0 0 1 -1 0 2.9 923 -1.5% Green 0 0 0 0 0 0.7 209 +0.7% Ward results
All Saints[12] Party Candidate Votes % ±% Liberal Democrat Stephen Jordan 811 59.1 +8.0% Conservative Peter Christensen 461 33.6 -3.9% Green Adrian Becker 61 4.4 +4.4% Labour Kevin Boyle 40 2.9 -2.9% Majority 350 25.5 +11.9 Turnout 1,373 31.9 +1.8% Liberal Democrat hold Swing Battledown[12] Party Candidate Votes % ±% Conservative Andrew Wall 1,013 66.7 -1.6 Liberal Democrat Paul McCloskey 442 29.1 +3.5 Labour Catherine Mozley 64 4.2 -1.9 Majority 571 37.6 -5.1 Turnout 1,519 41.4 -1.4 Conservative hold Swing Benhall and The Reddings[12] Party Candidate Votes % ±% Conservative Jacqueline Fletcher 945 50.7 +6.7 Liberal Democrat Christoper Pallet 918 49.3 -3.5 Majority 27 1.4 Turnout 1,863 46.1 +0.3 Conservative hold Swing Charlton Kings[12] Party Candidate Votes % ±% Conservative Duncan Smith 973 49.0 -9.8 Liberal Democrat Helena McCloskey 940 47.4 +11.4 Labour Neville Mozley 71 3.6 -1.6 Majority 33 1.7 -21.1 Turnout 1,984 46.0 +0.7 Conservative hold Swing Charlton Park[12] Party Candidate Votes % ±% Conservative Klara Sudbury 1,285 67.9 +3.8 Liberal Democrat Margaret Woodward 607 32.1 -3.8 Majority 678 35.8 +7.7 Turnout 1,892 47.0 -1.6 Conservative hold Swing College[12] Party Candidate Votes % ±% Liberal Democrat Lloyd Surgenor 997 59.0 +3.2 Conservative Timothy Mahon 692 41.0 -3.2 Majority 305 18.1 +6.4 Turnout 1,689 39.5 +2.1 Liberal Democrat hold Swing Hesters Way[12] Party Candidate Votes % ±% Liberal Democrat Wendy Flynn 779 65.1 -1.3 Conservative Philip Woolley 351 29.3 +3.3 Labour Clive Harriss 67 5.6 -2.0 Majority 428 35.8 -4.6 Turnout 1,197 24.3 -4.0 Liberal Democrat hold Swing Lansdown[12] Party Candidate Votes % ±% Conservative Diggory Seacome 759 59.3 -8.9 Liberal Democrat Leone Meyer 428 33.5 +1.7 Labour Janet Thomas 92 7.2 +7.2 Majority 331 25.9 -10.5 Turnout 1,279 28.2 -1.5 Conservative hold Swing Leckhampton[12] Party Candidate Votes % ±% Conservative Robin MacDonald 1,210 56.0 -4.5 Liberal Democrat Christopher Coleman 950 44.0 +4.5 Majority 260 12.0 -8.9 Turnout 2,160 52.9 +1.5 Conservative hold Swing Oakley[12] Party Candidate Votes % ±% Liberal Democrat Martin Dunn 661 51.3 +5.8 Conservative Susie Godwin 403 31.3 +13.2 Labour Brian Hughes 224 17.4 -19.0 Majority 258 20.0 +10.9 Turnout 1,288 30.1 -2.2 Liberal Democrat gain from Labour Swing Park[12] Party Candidate Votes % ±% Conservative Heather McLAin 1,273 67.7 +1.5 Liberal Democrat Phillippa Stewart 607 32.3 -1.5 Majority 666 35.4 +3.0 Turnout 1,880 36.8 -3.7 Conservative hold Swing Pittville[12] Party Candidate Votes % ±% Conservative Tim Cooper 625 38.7 +13.7 Liberal Democrat Rowena Hay 541 33.5 +8.0 People Against Bureaucracy Action Group Mary Nelson 318 19.7 -26.1 Green Cathy Green 65 4.0 +4.0 Labour Sandra Easton-Lawrence 64 4.0 +0.2 Majority 84 5.2 Turnout 1,613 37.7 -1.2 Conservative gain from Independent Swing Prestbury[12] Party Candidate Votes % ±% People Against Bureaucracy Action Group Malcolm Stennett 1,098 55.1 +0.3 Conservative Haydn Pearl 539 27.0 -6.5 Liberal Democrat Jennifer Jones 253 12.7 +1.0 Labour Jonquil Naish 104 5.2 +5.2 Majority 559 28.0 +6.7 Turnout 1,994 41.7 -0.5 Independent hold Swing Springbank[12] Party Candidate Votes % ±% Liberal Democrat Simon Wheeler 752 67.3 +5.4 Conservative Simon Probert 366 32.7 -5.4 Majority 386 34.5 +10.6 Turnout 1,118 23.1 -1.0 Liberal Democrat hold Swing St Marks[12] Party Candidate Votes % ±% Liberal Democrat John Webster 622 50.3 -3.9 Conservative Patsy Shilling 423 34.2 -1.4 Labour Rod Gay 108 8.7 -1.6 Green John Heyward 83 6.7 +6.7 Majority 199 16.1 -2.5 Turnout 1,236 26.4 -1.8 Liberal Democrat hold Swing St Pauls[12] Party Candidate Votes % ±% Liberal Democrat Paul Wheeldon 493 65.7 +14.5 Conservative Paul Ryder 257 34.3 +15.6 Majority 236 31.5 -1.0 Turnout 750 16.0 -3.5 Liberal Democrat hold Swing St Peters[12] Party Candidate Votes % ±% Liberal Democrat John Rawson 738 57.9 +11.7 Conservative John Hopwood 447 35.1 -10.0 Labour Robert Irons 89 7.0 -1.8 Majority 291 22.8 +21.7 Turnout 1,274 26.0 +0.6 Liberal Democrat hold Swing Swindon Village[12] Party Candidate Votes % ±% Liberal Democrat Bernard Fisher 875 57.4 +9.7 People Against Bureaucracy Peter Allen 367 24.1 -11.0 Conservative Leon Mekitarian 282 18.5 +1.3 Majority 508 33.3 +20.7 Turnout 1,524 33.4 +1.3 Liberal Democrat gain from Independent Swing Up Hatherley[12] Party Candidate Votes % ±% Liberal Democrat Roger Whyborn 1,115 58.4 +19.7 Conservative Alan Nicholson 793 41.6 -3.1 Majority 322 16.9 Turnout 1,908 45.0 -1.6 Liberal Democrat gain from Conservative Swing Warden Hill[12] Party Candidate Votes % ±% Conservative Anne Regan 1,245 70.1 +6.8 Liberal Democrat Frances McVeigh 530 29.9 -6.8 Majority 715 40.3 +12.6 Turnout 1,775 39.7 -3.0 Conservative hold Swing References
- ^ "Cheltenham". BBC News Online. http://news.bbc.co.uk/1/shared/bsp/hi/elections/local_council/08/html/23ub.stm. Retrieved 2010-10-24.
- ^ "Local elections: Results: Voters in the cities and the shires have their say in the ballot box". The Guardian. 2008-05-02. p. 7.
- ^ a b c "Race is on for poll position". Gloucestershire Echo. 2008-04-12. http://www.highbeam.com/doc/1P2-16231049.html. Retrieved 2010-10-24.
- ^ "Two party leaders turn up at once - a bit like buses ; David Cameron met with council candidates in the West yesterday ahead of next week's local elections after a brief encounter with his bitter rival". Western Daily Press. 2008-04-26. http://www.highbeam.com/doc/1P2-16448766.html. Retrieved 2010-10-24.
- ^ "Tory leader in a great hurry". The Citizen Gloucestershire. 2008-04-26. http://www.highbeam.com/doc/1P2-16447492.html. Retrieved 2010-10-24.
- ^ "Ups and downs but few surprises in poll results ; Across the South West election results held few surprises and little change for local authorities". Western Daily Press. 2008-05-03. http://www.highbeam.com/doc/1P2-16455739.html. Retrieved 2010-10-24.
- ^ a b c "Election results in for councils". BBC News Online. 2008-05-02. http://news.bbc.co.uk/1/hi/england/gloucestershire/7376851.stm. Retrieved 2010-10-25.
- ^ a b c d "Lib Dems swing it by the skin of their teeth". Gloucestershire Echo. 2008-05-02. http://www.highbeam.com/doc/1P2-16454088.html. Retrieved 2010-10-24.
- ^ "Labour's upbeat despite defeat". Gloucestershire Echo. 2008-05-07. http://www.highbeam.com/doc/1P2-16332142.html. Retrieved 2010-10-24.
- ^ "Shift of power ; The Liberal Democrats are to take charge of Cheltenham Borough Council, which remained hung after the May 1 local elections". Western Daily Press. 2008-05-10. http://www.highbeam.com/doc/1P2-16344030.html. Retrieved 2010-10-24.
- ^ "Leader sets sights on Lib Dem future". Gloucestershire Echo. 2008-05-10. http://www.highbeam.com/doc/1P2-16343525.html. Retrieved 2010-10-24.
- ^ a b c d e f g h i j k l m n o p q r s t u "Borough Council elections 1st May 2008". Cheltenham Borough Council. http://www.cheltenham.gov.uk/downloads/2008.pdf. Retrieved 2010-10-24.
- ^ "Local elections 08 nationwide results". The Times. 2008-05-03. p. 14.
Preceded by
Cheltenham Council election, 2006Cheltenham local elections Succeeded by
Cheltenham Council election, 2010(2007 ←) United Kingdom local elections, 2008 (→ 2009) Metropolitan borough elections Barnsley · Birmingham · Bolton · Bradford · Bury · Calderdale · Coventry · Doncaster · Dudley · Gateshead · Kirklees · Knowsley · Leeds · Liverpool · Manchester · Newcastle upon Tyne · North Tyneside · Oldham · Rochdale · Rotherham · Salford · Sandwell · Sefton · Sheffield · Solihull · South Tyneside · St Helens · Stockport · Sunderland · Tameside · Trafford · Wakefield · Walsall · Wigan · Wirral · Wolverhampton
Unitary authorities Blackburn with Darwen · Cheshire East · Cheshire West and Chester · Derby · Durham · Halton · Hartlepool · Kingston upon Hull · Milton Keynes · North East Lincolnshire · Northumberland · Peterborough · Plymouth · Portsmouth · Reading · Slough · Southampton · Southend-on-Sea · Stoke-on-Trent · Swindon · Thurrock · Warrington · WokinghamDistrict councils Adur · Amber Valley · Barrow-in-Furness · Basildon · Basingstoke and Deane · Bassetlaw · Brentwood · Broxbourne · Burnley · Cambridge · Cannock Chase · Carlisle · Castle Point · Cheltenham · Cherwell · Chorley · Colchester · Craven · Crawley · Daventry · Eastleigh · Elmbridge · Epping Forest · Exeter · Fareham · Gloucester · Gosport · Great Yarmouth · Harlow · Harrogate · Hart · Hastings · Havant · Hertsmere · Huntingdonshire · Hyndburn · Ipswich · Lincoln · Maidstone · Newcastle-under-Lyme · North Hertfordshire · Norwich · Nuneaton and Bedworth · Oxford · Pendle · Preston · Purbeck · Redditch · Reigate and Banstead · Rochford · Rossendale · Rugby · Runnymede · Rushmoor · South Cambridgeshire · South Lakeland · St Albans · Stevenage · Stratford-on-Avon · Stroud · Swale · Tamworth · Tandridge · Three Rivers · Tunbridge Wells · Watford · Waveney · Welwyn Hatfield · West Lancashire · West Lindsey · West Oxfordshire · Weymouth and Portland · Winchester · Woking · Worcester · Worthing · Wyre ForestWelsh councils Blaenau Gwent · Bridgend · Caerphilly · Cardiff · Carmarthenshire · Ceredigion · Conwy · Denbighshire · Flintshire · Gwynedd · Isle of Anglesey · Merthyr Tydfil · Monmouthshire · Neath Port Talbot · Newport · Pembrokeshire · Powys · Rhondda Cynon Taff · Swansea · Torfaen · Vale of Glamorgan · WrexhamCategories:- English local elections, 2008
- Politics of Cheltenham
- Council elections in South West England
- English District Council elections
Wikimedia Foundation. 2010.