- Cheltenham Council election, 2006
-
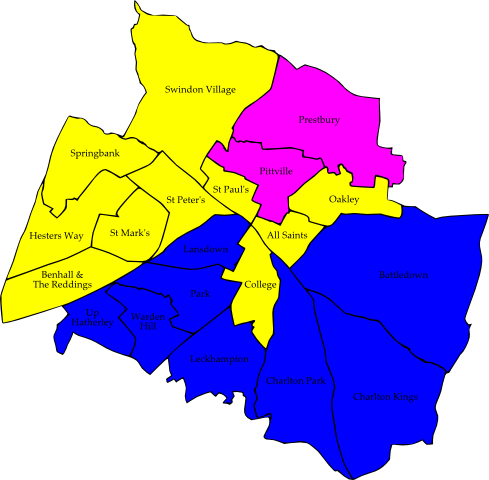
 Map of the results of the 2006 Cheltenham council election. Liberal Democrat in yellow, Conservatives in blue and People Against Bureaucracy in pink.
The 2006 Cheltenham Council election took place on 4 May 2006 to elect members of Cheltenham Borough Council in Gloucestershire, England. Half of the council was up for election and the council stayed under no overall control.[1]
After the election, the composition of the council was
- Liberal Democrat 17
- Conservative 17
- People Against Bureaucracy 5
- Labour 1[2]
Election result
The results of the election saw the Conservatives and Liberal Democrats end with 17 seats each.[3] The Labour party lost one of their two seats leaving the People Against Bureaucracy Action Group holding the balance of power.[3] Overall turnout in the election was 36.32%.[4]
After the election Conservative Duncan Smith took over as leader of the council, replacing Liberal Democrat Andrew McKinlay, after the Conservatives received the backing of the People Against Bureaucracy Action Group.[5]
Cheltenham Local Election Result 2006[6][7] Party Seats Gains Losses Net gain/loss Seats % Votes % Votes +/- Liberal Democrat 10 1 2 -1 50.0 40.8 12,714 +6.3% Conservative 8 2 0 +2 40.0 45.9 14,281 +2.4% People Against Bureaucracy Action Group 2 0 0 0 10.0 8.3 2,570 -1.4% Labour 0 0 1 -1 0 4.4 1,360 -4.1% Independent 0 0 0 0 0 0.5 141 -0.9% UKIP 0 0 0 0 0 0.2 70 +0.2% Ward results
All Saints[6][4] Party Candidate Votes % ±% Liberal Democrat Christine Franklin 639 51.1 +6.8 Conservative Susan McArdle 469 37.5 +3.4 Labour Sandra Easton-Lawrence 73 5.8 -3.1 UKIP Timothy Warry 70 5.6 +5.6 Majority 170 13.6 +3.4 Turnout 1,251 30.1 -4.5 Liberal Democrat hold Swing Battledown[6][4] Party Candidate Votes % ±% Conservative Paul McLain 1,032 68.3 +7.4 Liberal Democrat Paul Wheeldon 387 25.6 -5.2 Labour Catherine Mozeley 92 6.1 -2.3 Majority 645 42.7 +12.6 Turnout 1,511 42.8 -5.5 Conservative hold Swing Benhall and Reddings[6][4] Party Candidate Votes % ±% Liberal Democrat Nigel Britter 971 52.8 +12.5 Conservative Michael D'Ambrosio 810 44.0 -9.4 Labour Brian Hughes 58 3.2 -3.1 Majority 161 8.8 Turnout 1,839 45.8 -2.3 Liberal Democrat hold Swing Charlton Kings[6][4] Party Candidate Votes % ±% Conservative Christine Ryder 1,113 58.8 +3.0 Liberal Democrat Stephen Harvey 681 36.0 +1.1 Labour Neville Mozely 99 5.2 -4.2 Majority 432 22.8 +1.9 Turnout 1,893 45.3 -4.3 Conservative hold Swing Charlton Park[6][4] Party Candidate Votes % ±% Conservative Penelope Hall 1,236 64.1 +0.1 Liberal Democrat Iain Dobie 693 35.9 +6.8 Majority 543 28.1 -6.9 Turnout 1,929 48.6 -1.0 Conservative hold Swing College[6][4] Party Candidate Votes % ±% Liberal Democrat Garth Barnes 904 55.8 +9.1 Conservative Heather McLain 715 44.2 +6.2 Majority 189 11.7 +3.0 Turnout 1,619 37.4 -4.5 Liberal Democrat hold Swing Hesters Way[6][4] Party Candidate Votes % ±% Liberal Democrat Lydia Bishop 846 66.4 +22.3 Conservative Philip Woolley 331 26.0 +7.4 Labour Kevin Boyle 97 7.6 -0.7 Majority 515 40.4 +25.3 Turnout 1,274 28.3 -0.9 Liberal Democrat hold Swing Lansdown[6][4] Party Candidate Votes % ±% Conservative Barbara Driver 880 68.2 +7.1 Liberal Democrat Michael Pictor 410 31.8 +8.0 Majority 470 36.4 -0.9 Turnout 1,290 29.7 -3.4 Conservative hold Swing Leckhampton[6][4] Party Candidate Votes % ±% Conservative Kenneth Buckland 1,258 60.5 -9.8 Liberal Democrat Christopher Braunholtz 823 39.5 +15.5 Majority 435 20.9 -25.5 Turnout 2,081 51.4 -0.8 Conservative hold Swing Oakley[6][4] Party Candidate Votes % ±% Liberal Democrat Colin Hay 598 45.5 +8.3 Labour Martin Hale 478 36.4 -1.6 Conservative Lawrence McArdle 237 18.1 -6.7 Majority 120 9.1 Turnout 1,313 32.3 -0.3 Liberal Democrat gain from Labour Swing Park[6][4] Party Candidate Votes % ±% Conservative Robert Garnham 1,308 66.2 +7.1 Liberal Democrat Bernard Fisher 668 33.8 +1.3 Majority 640 32.4 +5.8 Turnout 1,976 40.5 -3.5 Conservative hold Swing Pittville[6][4] Party Candidate Votes % ±% People Against Bureaucracy Action Group Diane Hibbert 750 45.8 -2.3 Liberal Democrat Rowena Hay 417 25.5 +11.0 Conservative Stephen Wilkins 409 25.0 -6.1 Labour Frank Bench 62 3.8 +3.8 Majority 333 20.3 +3.4 Turnout 1,638 38.9 -5.0 Independent hold Swing Prestbury[6][4] Party Candidate Votes % ±% People Against Bureaucracy Action Group Leslie Godwin 1,050 54.8 +0.4 Conservative Eric Baylis 642 33.5 +5.1 Liberal Democrat Philip Brown 225 11.7 +3.8 Majority 408 21.3 -4.7 Turnout 1,917 42.2 -3.4 Independent hold Swing Springbank[6][4] Party Candidate Votes % ±% Liberal Democrat Christopher Morris 687 61.9 +8.3 Conservative Anthony Sygerycz 422 38.1 +4.0 Majority 265 23.9 +4.4 Turnout 1,109 24.1 -0.2 Liberal Democrat hold Swing St Marks[6][4] Party Candidate Votes % ±% Liberal Democrat Sandra Holliday 681 54.2 +7.6 Conservative Timothy Rogers 447 35.6 -0.1 Labour Clive Harriss 129 10.3 -7.4 Majority 234 18.6 +7.8 Turnout 1,257 28.2 -3.8 Liberal Democrat hold Swing St Pauls[6][4] Party Candidate Votes % ±% Liberal Democrat Andrew McKinlay 424 51.2 -12.4 Conservative Christopher Andstey 155 18.7 +2.0 Independent Diane Hayes 141 17.0 +17.0 Labour Jonquil Naish 108 13.0 +13.0 Majority 269 32.5 -14.4 Turnout 828 19.5 -1.9 Liberal Democrat hold Swing St Peters[6][4] Party Candidate Votes % ±% Liberal Democrat Pat Thornton 542 46.2 +1.4 Conservative John Hopwood 529 45.1 +8.7 Labour Robert Irons 103 8.8 -1.5 Majority 13 1.1 -7.3 Turnout 1,174 25.4 -5.0 Liberal Democrat hold Swing Swindon Village[6][4] Party Candidate Votes % ±% Liberal Democrat Paul Massey 687 47.7 +9.8 People Against Bureaucracy Joanna McVeagh 506 35.1 -6.4 Conservative Leon Mekitarian 247 17.2 +1.9 Majority 181 12.6 Turnout 1,440 32.1 -4.5 Liberal Democrat hold Swing Up Hatherley[6][4] Party Candidate Votes % ±% Conservative David Hall 873 44.7 +9.7 Liberal Democrat Roger Whyborn 755 38.7 +5.3 People Against Bureaucracy Action Group Martin Burford 264 13.5 -11.7 Labour Gillian Howells 61 3.1 -3.3 Majority 118 6.0 +4.4 Turnout 1,953 46.6 +2.5 Conservative gain from Liberal Democrat Swing Warden Hill[6][4] Party Candidate Votes % ±% Conservative Stuart Hutton 1,168 63.3 +9.0 Liberal Democrat Lorraine Dunne 676 36.7 -1.1 Majority 492 26.7 +10.2 Turnout 1,844 42.7 -7.3 Conservative gain from Liberal Democrat Swing References
- ^ "Local electiond: Cheltenham". BBC News Online. http://news.bbc.co.uk/1/shared/bsp/hi/vote2006/locals/html/23ub.stm. Retrieved 2010-10-23.
- ^ Wilson, Graeme (2006-05-05). "Conservatives Cameron's crusade puts Tories back on victory trail". The Daily Telegraph. p. 4.
- ^ a b "Battle for control in Cheltenham". BBC News Online. 2006-05-05. http://news.bbc.co.uk/1/hi/england/gloucestershire/4975636.stm. Retrieved 2010-10-24.
- ^ a b c d e f g h i j k l m n o p q r s t u "Cheltenham Borough Council elections 4th May 2006 percentage poll". Cheltenham Borough Council. http://www.cheltenham.gov.uk/downloads/2006_percentage_poll_borough.pdf. Retrieved 2010-10-23.
- ^ "Tories to take control of council". BBC News Online. 2006-05-12. http://news.bbc.co.uk/1/hi/england/gloucestershire/4764141.stm. Retrieved 2010-10-24.
- ^ a b c d e f g h i j k l m n o p q r s t u "Borough election 2006". Cheltenham Borough Council. http://www.cheltenham.gov.uk/site/scripts/download_info.php?fileID=694. Retrieved 2010-10-23.
- ^ "Local elections". The Times. 2006-05-06. p. 64.
Preceded by
Cheltenham Council election, 2004Cheltenham local elections Succeeded by
Cheltenham Council election, 2008(2005 ←) United Kingdom local elections, 2006 (→ 2007) London boroughs Barking and Dagenham · Barnet · Bexley · Brent · Bromley · Camden · Croydon · Ealing · Enfield · Greenwich · Hackney · Hammersmith and Fulham · Haringey · Harrow · Havering · Hillingdon · Hounslow · Islington · Kensington and Chelsea · Kingston upon Thames · Lambeth · Lewisham · Merton · Newham · Redbridge · Richmond upon Thames · Southwark · Sutton · Tower Hamlets · Waltham Forest · Wandsworth · WestminsterMetropolitan boroughs Barnsley · Birmingham · Bolton · Bradford · Bury · Calderdale · Coventry · Doncaster · Dudley · Gateshead · Kirklees · Knowsley · Leeds · Liverpool · Manchester · Newcastle upon Tyne · North Tyneside · Oldham · Rochdale · Rotherham · Salford · Sandwell · Sefton · Sheffield · Solihull · South Tyneside · St Helens · Stockport · Sunderland · Tameside · Trafford · Wakefield · Walsall · Wigan · Wirral · Wolverhampton
Unitary authorities Blackburn with Darwen · Bristol · Derby · Halton · Hartlepool · Kingston upon Hull · Milton Keynes · North East Lincolnshire · Peterborough · Plymouth · Portsmouth · Reading · Slough · Southampton · Southend-on-Sea · Stoke-on-Trent · Swindon · Thurrock · Warrington · WokinghamDistrict councils Adur · Amber Valley · Barrow-in-Furness · Basildon · Basingstoke and Deane · Bassetlaw · Bedford · Brentwood · Broxbourne · Burnley · Cambridge · Cannock Chase · Carlisle · Castle Point · Cheltenham · Cherwell · Chester · Chorley · Colchester · Congleton · Craven · Crawley · Crewe and Nantwich · Daventry · Eastbourne · Eastleigh · Ellesmere Port and Neston · Elmbridge · Epping Forest · Exeter · Fareham · Gloucester · Gosport · Great Yarmouth · Harlow · Harrogate · Hart · Hastings · Havant · Hertsmere · Huntingdonshire · Hyndburn · Ipswich · Lincoln · Macclesfield · Maidstone · Mole Valley · Newcastle-under-Lyme · North Hertfordshire · Norwich · Nuneaton and Bedworth · Oxford · Pendle · Penwith · Preston · Purbeck · Redditch · Reigate and Banstead · Rochford · Rossendale · Rugby · Runnymede · Rushmoor · Shrewsbury and Atcham · South Bedfordshire · South Cambridgeshire · South Lakeland · St Albans · Stevenage · Stratford-on-Avon · Stroud · Swale · Tamworth · Tandridge · Three Rivers · Tunbridge Wells · Watford · Waveney · Welwyn Hatfield · West Lancashire · West Lindsey · West Oxfordshire · Weymouth and Portland · Winchester · Woking · Worcester · Worthing · Wyre ForestCategories:- English local elections, 2006
- Politics of Cheltenham
- Council elections in South West England
- English District Council elections
Wikimedia Foundation. 2010.