- Maidstone Council election, 2008
-
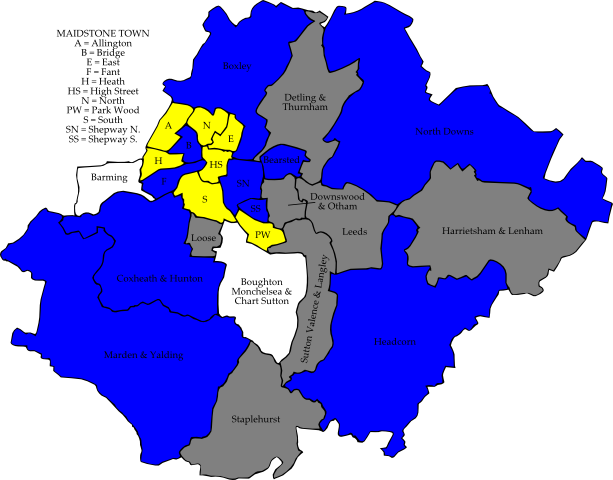
 Map of the results of the 2008 Maidstone council election. Conservatives in blue, Liberal Democrats in yellow and independents in white. Wards in grey were not contested in 2008.
The 2008 Maidstone Council election took place on 1 May 2008 to elect members of Maidstone Borough Council in Kent, England. One third of the council was up for election and the Conservative party gained overall control of the council from no overall control.[1]
After the election, the composition of the council was
- Conservative 29
- Liberal Democrat 20
- Independent 5
- Labour 1[2]
Contents
Background
Before the election the Conservatives were the largest party on the council with 27 seats, but did not have a majority.[3] The council however was run by a coalition of the other groups, with the Liberal Democrats leading an alliance with Labour and the independents.[3] Between them these groups had 28 seats, until the resignation of Liberal Democrat councillor Peter Hooper, after he was arrested in relation to a computer-related crime, left them with the same number of seats as the Conservatives.[3]
19 seats were being contested in the election, with the Conservatives defending 8 and the Liberal Democrats 7.[3]
Election result
The results saw the Conservatives gain a majority of the council after making a net gain of 2 seats, in what was the first time any party had a majority on the council for 25 years.[4] The Conservatives went up to 29 seats, while the Liberal Democrats dropped one seat to 20.[4] The Labour group leader Morel D'Souza was defeated in Fant ward and his party was reduced to just 1 seat.[4] Meanwhile the independents went up by 1 seat to have 5 seats on the council.[4] Overall turnout in the election was 35.58%.[5]
Maidstone Local Election Result 2008[5][6] Party Seats Gains Losses Net gain/loss Seats % Votes % Votes +/- Conservative 10 3 1 +2 52.6 49.7 16,328 +0.5% Liberal Democrat 7 0 1 -1 36.8 32.7 10,732 -0.5% Independent 2 1 0 +1 10.5 4.0 1,311 -1.4% Labour 0 0 2 -2 0 6.7 2,215 +0.8% Green 0 0 0 0 0 6.0 1,981 +0.7% UKIP 0 0 0 0 0 0.8 263 +0.8% Ward results
Allington[5] Party Candidate Votes % ±% Liberal Democrat Malcolm Robertson 1,437 59.6 -4.3 Conservative Jeff Curwood 724 30.0 +1.2 Labour Marianna Poliszczuk 108 4.5 -2.8 UKIP Gareth Kendall 86 3.6 +3.6 Green Amanda Evans 57 2.4 +2.4 Majority 713 29.6 -5.5 Turnout 2,412 42.9 +0.2 Liberal Democrat hold Swing Barming[5] Party Candidate Votes % ±% Independent Fay Gooch 552 51.9 +51.9 Conservative Cass Jappie 474 44.5 -40.2 Labour Wendy Hollands 38 3.6 -2.6 Majority 78 7.3 Turnout 1,064 54.2 +0.3 Independent gain from Conservative Swing Bearsted[5] Party Candidate Votes % ±% Conservative Richard Ash 1,937 74.7 +4.7 Liberal Democrat Steven Hunter 481 18.5 +0.0 Green Ian McDonald 176 6.8 -4.5 Majority 1,456 56.1 +4.5 Turnout 2,594 39.7 -3.2 Conservative hold Swing Boughton Monchelsea and Chart Sutton[5] Party Candidate Votes % ±% Independent Mike Fitzgerald 759 89.9 +19.8 UKIP Keith Woollven 85 10.1 +10.1 Majority 674 79.9 +35.6 Turnout 844 42.0 -8.0 Independent hold Swing Boxley[5] Party Candidate Votes % ±% Conservative Wendy Hinder 1,607 78.8 +11.6 Liberal Democrat John Doherty 321 15.7 -9.6 Green Patricia Marchant 111 5.7 +5.7 Majority 1,286 63.1 +21.3 Turnout 2,039 31.4 -1.5 Conservative hold Swing Bridge[5] Party Candidate Votes % ±% Conservative James Ross 671 44.8 +3.4 Liberal Democrat David Pickett 640 42.7 -7.8 Labour Sally Willcox 100 6.7 +6.7 Green Angela Wooi 88 5.9 -2.2 Majority 31 2.1 Turnout 1,499 35.3 +0.6 Conservative gain from Liberal Democrat Swing Coxheath and Hunton[5] Party Candidate Votes % ±% Conservative John Wilson 1,354 50.9 +3.8 Liberal Democrat Moira Walter 1,206 45.4 -2.4 Labour Michael Casserley 99 3.7 -1.3 Majority 148 5.6 Turnout 2,659 48.3 +0.6 Conservative hold Swing East[5] Party Candidate Votes % ±% Liberal Democrat Patrick Sellar 1,331 56.7 +2.6 Conservative Edward Winstanley 879 37.4 +1.8 Green James Shalice 139 5.9 +2.1 Majority 452 19.2 +0.7 Turnout 2,349 37.3 -4.1 Liberal Democrat hold Swing Fant[5] Party Candidate Votes % ±% Conservative Stephen Paine 679 33.3 +9.7 Liberal Democrat Fran Smith 562 27.6 -12.6 Labour Morel D'Souza 470 23.1 +10.4 Green Stuart Jeffery 326 16.0 -1.8 Majority 117 5.7 Turnout 2,037 32.7 -0.9 Conservative gain from Labour Swing Headcorn[5] Party Candidate Votes % ±% Conservative Richard Thick 1,164 66.7 +5.8 Green Penny Kemp 581 33.3 -5.8 Majority 583 33.4 +11.5 Turnout 1,745 45.2 +3.3 Conservative hold Swing Heath[5] Party Candidate Votes % ±% Liberal Democrat Bryan Vizzard 562 45.4 -3.4 Conservative Mark Mears 518 41.8 -1.2 Labour Patrick Coates 83 6.7 -1.5 Green Andrew Waldie 75 6.1 +6.1 Majority 44 3.6 -2.2 Turnout 1,238 30.2 -3.2 Liberal Democrat hold Swing High Street[5] Party Candidate Votes % ±% Liberal Democrat Denise Joy 738 43.9 -2.9 Conservative Paul Butcher 611 36.3 +3.4 Labour Richard Coates 152 9.0 -2.2 UKIP John Stanford 92 5.5 +5.5 Green Wendy Lewis 89 5.3 -3.8 Majority 127 7.6 -6.3 Turnout 1,682 28.6 +0.8 Liberal Democrat hold Swing Marden and Yalding[5] Party Candidate Votes % ±% Conservative John Verrall 1,506 72.9 +10.2 Liberal Democrat Geoffrey Samme 320 15.5 -4.5 Labour Edith Davis 240 11.6 +1.4 Majority 1,186 57.4 +14.7 Turnout 2,066 35.2 -1.3 Conservative hold Swing North[5] Party Candidate Votes % ±% Liberal Democrat Jennifer Paterson 1,012 59.4 +5.4 Conservative Jeff Tree 552 32.4 +4.6 Green Derek Eagle 141 8.3 +0.2 Majority 460 27.0 +0.7 Turnout 1,705 29.3 -2.7 Liberal Democrat hold Swing North Downs[5] Party Candidate Votes % ±% Conservative Daphne Parvin 599 76.9 +17.4 Liberal Democrat John Watson 96 12.3 -2.9 Green Sarah Goodwin 84 10.8 +10.8 Majority 503 64.6 +20.5 Turnout 779 39.2 -6.3 Conservative hold Swing Park Wood[5] Party Candidate Votes % ±% Liberal Democrat Robert Field 447 54.1 +20.0 Conservative Susan Yates 258 31.2 +0.3 Labour Liz Stevens 122 14.8 -20.1 Majority 189 22.9 Turnout 827 24.5 -4.2 Liberal Democrat hold Swing Shepway North[5] Party Candidate Votes % ±% Conservative Christopher Garland 1,091 60.6 +6.8 Labour Gill Annan 375 20.8 +1.3 Liberal Democrat Peter Batt 220 12.2 +1.3 Green Stephen Muggeridge 114 6.3 -0.2 Majority 716 39.8 +5.5 Turnout 1,800 28.7 -1.3 Conservative hold Swing Shepway South[5] Party Candidate Votes % ±% Conservative Bob Hinder 525 51.9 +15.9 Labour Ken Stevens 324 32.0 -5.1 Liberal Democrat Maria Sotelo-Moratinos 163 16.1 +3.0 Majority 201 19.9 Turnout 1,012 23.7 -1.5 Conservative gain from Labour Swing South[5] Party Candidate Votes % ±% Liberal Democrat Ian Chittenden 1,196 48.2 Conservative Scott Hahnefeld 1,179 47.6 Labour John Randall 104 4.2 Majority 17 0.7 Turnout 2,479 41.6 +0.9 Liberal Democrat hold Swing References
- ^ "Maidstone". BBC News Online. http://news.bbc.co.uk/1/shared/bsp/hi/elections/local_council/08/html/29uh.stm. Retrieved 8 March 2011.
- ^ "National: Full election results". The Guardian: p. 45. 3 May 2008.
- ^ a b c d "Voters head to the polls in local elections". kentnews.co.uk. 1 May 2008. http://www.kentnews.co.uk/default.aspx?page=12&terms=12504&domain=http://www.kentnews.co.uk. Retrieved 10 March 2011.
- ^ a b c d "Tories take control in Maidstone". BBC News Online. 2 May 2008. http://news.bbc.co.uk/1/hi/england/kent/7378982.stm. Retrieved 9 March 2011.
- ^ a b c d e f g h i j k l m n o p q r s t u "Election Results 2008". Maidstone Borough Council. http://www.maidstone.gov.uk/pdf/Election%20Results%202008.pdf. Retrieved 8 March 2011.
- ^ "Local elections 08 nationwide results". The Times: p. 14. 3 May 2008.
Preceded by
Maidstone Council election, 2007Maidstone local elections Succeeded by
Maidstone Council election, 2010(2007 ←) United Kingdom local elections, 2008 (→ 2009) Metropolitan borough elections Barnsley · Birmingham · Bolton · Bradford · Bury · Calderdale · Coventry · Doncaster · Dudley · Gateshead · Kirklees · Knowsley · Leeds · Liverpool · Manchester · Newcastle upon Tyne · North Tyneside · Oldham · Rochdale · Rotherham · Salford · Sandwell · Sefton · Sheffield · Solihull · South Tyneside · St Helens · Stockport · Sunderland · Tameside · Trafford · Wakefield · Walsall · Wigan · Wirral · Wolverhampton
Unitary authorities Blackburn with Darwen · Cheshire East · Cheshire West and Chester · Derby · Durham · Halton · Hartlepool · Kingston upon Hull · Milton Keynes · North East Lincolnshire · Northumberland · Peterborough · Plymouth · Portsmouth · Reading · Slough · Southampton · Southend-on-Sea · Stoke-on-Trent · Swindon · Thurrock · Warrington · WokinghamDistrict councils Adur · Amber Valley · Barrow-in-Furness · Basildon · Basingstoke and Deane · Bassetlaw · Brentwood · Broxbourne · Burnley · Cambridge · Cannock Chase · Carlisle · Castle Point · Cheltenham · Cherwell · Chorley · Colchester · Craven · Crawley · Daventry · Eastleigh · Elmbridge · Epping Forest · Exeter · Fareham · Gloucester · Gosport · Great Yarmouth · Harlow · Harrogate · Hart · Hastings · Havant · Hertsmere · Huntingdonshire · Hyndburn · Ipswich · Lincoln · Maidstone · Newcastle-under-Lyme · North Hertfordshire · Norwich · Nuneaton and Bedworth · Oxford · Pendle · Preston · Purbeck · Redditch · Reigate and Banstead · Rochford · Rossendale · Rugby · Runnymede · Rushmoor · South Cambridgeshire · South Lakeland · St Albans · Stevenage · Stratford-on-Avon · Stroud · Swale · Tamworth · Tandridge · Three Rivers · Tunbridge Wells · Watford · Waveney · Welwyn Hatfield · West Lancashire · West Lindsey · West Oxfordshire · Weymouth and Portland · Winchester · Woking · Worcester · Worthing · Wyre ForestWelsh councils Blaenau Gwent · Bridgend · Caerphilly · Cardiff · Carmarthenshire · Ceredigion · Conwy · Denbighshire · Flintshire · Gwynedd · Isle of Anglesey · Merthyr Tydfil · Monmouthshire · Neath Port Talbot · Newport · Pembrokeshire · Powys · Rhondda Cynon Taff · Swansea · Torfaen · Vale of Glamorgan · WrexhamCategories:- English local elections, 2008
- Council elections in Kent
- English District Council elections
- Maidstone (borough)
Wikimedia Foundation. 2010.