- Oxford City Council election, 2010
-
Elections for Oxford City Council were held on Thursday 6 May 2010.[1] As Oxford City Council is elected by halves, one seat in each of the 24 wards was up for election.
Labour gained 2 seats (Barton and Sandhills ward from the Liberal Democrats and Northfield Brook ward from the Independent Working Class Association), the Liberal Democrats also gained two seats (Carfax and St Clement's ward, both from the Green Party). As a result of this election, Labour gained control of the city council, with 25 out of 48 seats.
A general election was held on the same day, which accounts for the higher turnout (61.7%).
Election results
Oxford Local Election Result 2010 Party Seats Gains Losses Net gain/loss Seats % Votes % Votes +/- Labour 13 2 0 +2 54.2 34.5 23,716 −0.1 Liberal Democrat 9 2 1 +1 37.5 30.6 21,038 +7.8 Green 2 0 2 −2 8.3 14.0 9,637 −2.9 Conservative 0 0 0 0 0 19.6 13,490 −0.6 UKIP 0 0 0 0 0 0.2 136 N/A Independent 0 0 0 0 0 1.0 671 −0.6 Note: one Independent is standing in 2010, compared with three in 2008 and two in 2006. No candidates representing the Independent Working Class Association are standing in this election. No UKIP candidates were standing in 2008.
This result has the following consequences for the total number of seats on the Council after the elections:
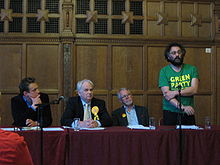 Political group leaders and senior politicians for the Oxford City Council (outgoing council at the election in 2010). From left to right: Jonathan Gittos candidate for the Conservatives, Councillor Stephen Brown leader of the political group of Liberal Democrats, Councillor John Tanner senior member of the Labour group, Councillor Craig Simmons leader of the Green group.
Party Previous council Staying councillors Seats up for election Election result New council Labour 23 12 11 13 25 Liberal Democrats 16 8 8 9 17 Green 7 3 4 2 5 Independent Working Class 2 1 1 0 1 Conservatives 0 0 0 0 0 UKIP 0 0 0 0 0 Independent 0 0 0 0 0 Total 48 24 24 24 48 Results by ward
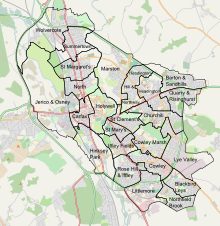 Map of the Oxford wards
Note: Gains and holds of wards are noted with respect to the 2006 council election (or a by-election of the same seat). Percentage changes are given with respect to the 2008 council election (or the latest by-election).
Turnout figures are the sum of the votes for each candidate only and do not yet include rejected ballots. These numbers will be included in the sum when available.
Barton and Sandhills
Party Candidate Votes % ±% Labour Van Coulter 1,239 42.7 +8.7 Liberal Democrat Barry Crossman 815 28.1 −6.2 Conservative Timothy Hamer 661 22.8 −3.6 Green Raymond Hitchins 188 6.5 +1.2 Turnout 2,903 Labour gain from Liberal Democrat Swing Blackbird Leys
Party Candidate Votes % ±% Labour Rae Humberstone 1,510 69.5 +15.2 Conservative Elizabeth Mills 299 13.8 +7.2 Liberal Democrat Mark Wheeler 270 12.4 +10.7 Green Jackie Chandler-Oatts 93 4.3 +1.9 Turnout 2,172 Labour hold Swing Carfax
Party Candidate Votes % ±% Liberal Democrat Tony Brett 985 37.6 +1.9 Green Vincent Larochelle 565 21.6 +1.8 Labour Joe Ottaway 535 20.4 +3.1 Conservative Patricia Jones 535 20.4 −6.7 Turnout 2,620 Liberal Democrat gain from Green Swing Churchill
Party Candidate Votes % ±% Labour Joe McManners 1,168 47.6 +5.9 Liberal Democrat Peter Bonney 629 25.6 +9.5 Conservative Jonathan Asbridge 469 19.1 +6.9 Green Julian Faultless 187 7.6 +4.3 Turnout 2,453 Labour hold Swing Cowley
Party Candidate Votes % ±% Labour Shah Khan 1,264 45.9 −2.3 Liberal Democrat Qasim Aziz 601 21.8 +6.2 Conservative Judith Harley 506 18.4 +1.0 Green Clare Valerie 385 14.0 +1.5 Turnout 2,756 Labour hold Swing Note that Shah Khan won the Cowley seat in the 2006 elections for the Liberal Democrats, but crossed the floor to Labour in 2007. So when comparing to the 2006 elections, Labour gain from Liberal Democrats.
Cowley Marsh
Party Candidate Votes % ±% Labour Mohammed Abbasi 1,124 39.8 −11.6 Liberal Democrat Shah Nawaz 816 28.9 −0.8 Green John Kentish 467 16.5 +6.3 Conservative Clara Bantry White 415 14.7 +6.0 Turnout 2,822 Labour hold Swing Headington
Party Candidate Votes % ±% Liberal Democrat David Rundle 1,297 44.6 +9.2 Labour Jane Darke 761 26.2 +9.5 Conservative Paul Hernandez 572 19.7 −14.7 Green Jill Haas 275 9.5 −4.0 Turnout 2,905 Liberal Democrat hold Swing Headington Hill and Northway
Party Candidate Votes % ±% Liberal Democrat Mohammed Altaf-Khan 1,054 41.7 +15.3 Labour Jamila Azad 733 29.0 −9.3 Conservative Siddo Deva 521 20.6 −10.4 Green Chris Brewer 218 8.6 +4.3 Turnout 2,526 Liberal Democrat hold Swing Note: ±% figures are calculated with respect to the results of the by-election of 26 March 2009.
Hinksey Park
Party Candidate Votes % ±% Labour Bob Price 1,530 48.9 −3.3 Liberal Democrat John Pinfold 681 21.8 +10.7 Conservative Simon Mort 501 16.0 +2.7 Green Chip Sherwood 417 13.3 −10.1 Turnout 3,129 Labour hold Swing Holywell
Party Candidate Votes % ±% Liberal Democrat Mark Mills 1,073 38.9 −1.5 Green Sophie Lewis 621 22.5 +7.0 Conservative Frances Kennett 583 21.2 −2.9 Labour Alistair Strathern 478 17.4 −2.6 Turnout 2,755 Liberal Democrat hold Swing Note: ±% figures are calculated with respect to the results of the by-election of 12 June 2008.
Iffley Fields
Party Candidate Votes % ±% Green David Williams 1,094 37.2 −21.4 Labour Mike Rowley 889 30.3 −0.2 Liberal Democrat Doug Hale 667 22.7 N/A Conservative Carolyn Ten Holter 288 9.8 −1.1 Turnout 2,938 Green hold Swing Jericho and Osney
Party Candidate Votes % ±% Labour Susanna Pressel 1,793 53.0 −0.2 Liberal Democrat Catherine Hilliard 769 22.7 +5.1 Conservative Bill Wilson 513 15.2 +2.5 Green Kaihsu Tai 311 9.2 −7.3 Turnout 3,386 Labour hold Swing Littlemore
Party Candidate Votes % ±% Labour Gill Sanders 1,299 47.8 −2.9 Liberal Democrat Dorian Hancock 641 23.6 +12.8 Conservative Yvonne Lowe 585 21.5 −3.3 Green Jenny Nicholson 191 7.0 −6.7 Turnout 2,716 Labour hold Swing Lye Valley
Party Candidate Votes % ±% Labour Ben Lloyd-Shogbesan 1,320 44.9 −15.1 Liberal Democrat Faisal Aziz 697 23.7 +14.8 Conservative Allen Mills 647 22.0 +1.1 Green Anna Pickering 275 9.4 −0.8 Turnout 2,939 Labour hold Swing Marston
Party Candidate Votes % ±% Labour Mary Clarkson 1,292 38.9 +4.4 Independent Mick Haines 671 20.2 −0.4 Liberal Democrat Farida Anwar 622 18.7 −6.9 Conservative Duncan Hatfield 468 14.1 −0.1 Green Alistair Morris 272 8.2 +3.1 Turnout 3,325 Labour hold Swing North
Party Candidate Votes % ±% Liberal Democrat Alan Armitage 1,303 44.6 +7.4 Conservative Mark Hanson 715 24.5 −5.8 Labour Michael Boyd 489 16.7 +1.9 Green Peter Furtado 413 14.1 −3.6 Turnout 2,920 Liberal Democrat hold Swing Northfield Brook
Party Candidate Votes % ±% Labour Scott Seamons 1,264 Liberal Democrat Rosemary Morlin 503 Conservative Robin Lomax 419 Green Alyson Duckmanton 140 Turnout 2,326 Labour gain from Independent Working Class Swing Quarry and Risinghurst
Party Candidate Votes % ±% Labour Dee Sinclair 1,276 Liberal Democrat Gavin Baylis 938 Conservative Tia Macgregor 733 Green Sue Tibbles 207 UKIP Julia Gasper 136 Turnout 3,290 Labour hold Swing Rose Hill and Iffley
Party Candidate Votes % ±% Labour Antonia Bance 1,356 50.3 Liberal Democrat John Wilde 619 23.0 Conservative Moznu Miah 438 16.2 Green Rachel Bottley 284 10.5 Turnout 2,697 Labour hold Swing St. Clement's
Party Candidate Votes % ±% Liberal Democrat Graham Jones 898 Green Mary-Jane Sareva 884 Labour Sabir Mirza 762 Conservative Neil Prestidge 500 Turnout 3,044 Liberal Democrat gain from Green Swing St. Margaret's
Party Candidate Votes % ±% Liberal Democrat Jim Campbell 1,390 49.0 +15.6 Conservative Vernon Porter 727 25.6 −1.3 Green Hafiz Ladell 384 13.5 −14.3 Labour James Fry 335 11.8 −0.2 Turnout 2,836 Liberal Democrat hold Swing St. Mary's
Party Candidate Votes % ±% Green Dick Wolff 824 Liberal Democrat Peter Sloman 745 Labour Pat Kennedy 631 Conservative George Saliagopoulos 342 Turnout 2,542 Green hold Swing Summertown
Party Candidate Votes % ±% Liberal Democrat Jean Fooks 1,613 Conservative Laura Goodchild 904 Green Ann Duncan 498 Labour Tom Watts 321 Turnout 3,336 Liberal Democrat hold Swing Wolvercote
Party Candidate Votes % ±% Liberal Democrat John Goddard 1,412 42.0 Conservative Jonathan Gittos 1,149 34.3 Green Oliver Tickell 444 13.3 Labour Michael Taylor 347 10.4 Turnout 3,352 Liberal Democrat hold Swing 
References
Preceded by
Oxford City Council election, 2008Oxford Council elections Succeeded by
Oxford City Council election, 2012(2009 ←) United Kingdom local elections, 2010 (→ 2011) London boroughs Barking and Dagenham · Barnet · Bexley · Brent · Bromley · Camden · Croydon · Ealing · Enfield · Greenwich · Hackney · Hammersmith and Fulham · Haringey · Harrow · Havering · Hillingdon · Hounslow · Islington · Kensington and Chelsea · Kingston upon Thames · Lambeth · Lewisham · Merton · Newham · Redbridge · Richmond upon Thames · Southwark · Sutton · Tower Hamlets · Waltham Forest · Wandsworth · WestminsterMetropolitan boroughs Barnsley · Birmingham · Bolton · Bradford · Bury · Calderdale · Coventry · Doncaster · Dudley · Gateshead · Kirklees · Knowsley · Leeds · Liverpool · Manchester · Newcastle upon Tyne · North Tyneside · Oldham · Rochdale · Rotherham · Salford · Sandwell · Sefton · Sheffield · Solihull · South Tyneside · St Helens · Stockport · Sunderland · Tameside · Trafford · Wakefield · Walsall · Wigan · Wirral · Wolverhampton
Unitary authorities Blackburn with Darwen · Bristol · Derby · Halton · Hartlepool · Kingston upon Hull · Milton Keynes · North East Lincolnshire · Peterborough · Plymouth · Portsmouth · Reading · Slough · Southampton · Southend-on-Sea · Stoke-on-Trent · Swindon · Thurrock · Warrington · WokinghamDistrict councils Adur · Amber Valley · Barrow-in-Furness · Basildon · Basingstoke and Deane · Bassetlaw · Brentwood · Broxbourne · Burnley · Cambridge · Cannock Chase · Carlisle · Castle Point · Cheltenham · Cherwell · Chorley · Colchester · Craven · Crawley · Daventry · Eastleigh · Elmbridge · Epping Forest · Fareham · Gloucester · Gosport · Great Yarmouth · Harlow · Harrogate · Hart · Hastings · Havant · Hertsmere · Huntingdonshire · Hyndburn · Ipswich · Lincoln · Maidstone · Mole Valley · Newcastle-under-Lyme · North Hertfordshire · Nuneaton and Bedworth · Oxford · Pendle · Preston · Purbeck · Redditch · Reigate and Banstead · Rochford · Rossendale · Rugby · Runnymede · Rushmoor · South Cambridgeshire · South Lakeland · St Albans · Stevenage · Stratford-on-Avon · Stroud · Swale · Tamworth · Tandridge · Three Rivers · Tunbridge Wells · Watford · Waveney · Welwyn Hatfield · West Lancashire · West Lindsey · West Oxfordshire · Weymouth and Portland · Winchester · Woking · Worcester · Worthing · Wyre ForestCategories:- Council elections in Oxford
- English local elections, 2010


Wikimedia Foundation. 2010.