- Morley and Rothwell (UK Parliament constituency)
-
Coordinates: 53°44′56″N 1°36′07″W / 53.749°N 1.602°W
Morley and Rothwell Former Borough constituency for the House of Commons 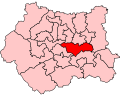
Boundary of Morley and Rothwell in West Yorkshire for the 2005 general election.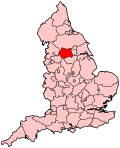
Location of West Yorkshire within England.County West Yorkshire Major settlements Morley, Rothwell, Middleton 1997–2010 Number of members One Replaced by Elmet and Rothwell, Morley and Outwood, Leeds Central Morley and Rothwell was a parliamentary constituency represented in the House of Commons of the Parliament of the United Kingdom. It elected one Member of Parliament (MP) by the first past the post system of election.
Contents
History
This constituency was created in 1997 and abolished in 2010. It was held for the entire period of its existence by the Labour Party.
Boundaries
The constituency covered the West Yorkshire towns of Morley and Rothwell, the villages that surround the towns, and the old pit village of Middleton.
Boundary review
Following their review of parliamentary representation in West Yorkshire, the Boundary Commission for England have created a number of modified constituencies as a consequence of a falling population.
A new constituency of Elmet and Rothwell has been created to move Rothwell from this seat. The successor seat to Morley and Rothwell is Morley and Outwood, which attaches wards from Wakefield to the Morley area. Middleton is being transferred to the Leeds Central seat.
Members of Parliament
Election Member [1] Party 1997 John Gunnell Labour 2001 Colin Challen Labour 2010 Constituency abolished: see Morley and Outwood,
Elmet and Rothwell and Leeds CentralElections
Elections in the 2000s
General Election 2005: Morley and Rothwell Party Candidate Votes % ±% Labour Colin Challen 20,570 48.4 −8.6 Conservative Nick Vineall 8,227 19.4 −6.2 Liberal Democrat Stewart Golton 6,819 16.0 +1.8 Independent Robert Finnigan 4,608 10.8 N/A BNP Chris Beverley 2,271 5.3 N/A Majority 12,343 29.0 Turnout 42,495 58.8 +5.3 Labour hold Swing General Election 2001: Morley and Rothwell Party Candidate Votes % ±% Labour Colin Challen 21,919 57.0 −1.5 Conservative David Schofield 9,829 25.6 −0.8 Liberal Democrat Stewart Golton 5,446 14.2 +3.1 UKIP John Bardsley 1,248 3.2 N/A Majority 12,090 31.4 Turnout 38,442 53.5 −13.5 Labour hold Swing Elections in the 1990s
General Election 1997: Morley and Rothwell Party Candidate Votes % ±% Labour John Gunnell 26,836 58.5 N/A Conservative Alan Barraclough 12,086 26.3 N/A Liberal Democrat Mitchell Galdas 5,087 11.1 N/A Referendum Party D. Mitchell-Innes 1,359 3.0 N/A BNP Roger Wood 381 0.8 N/A ProLife Alliance P. Sammon 148 0.3 N/A Majority 14,750 N/A Turnout 67.1 N/A Labour hold Swing N/A See also
Notes and references
Categories:- United Kingdom Parliamentary constituencies established in 1997
- United Kingdom Parliamentary constituencies disestablished in 2010
- Politics of Leeds
- Parliamentary constituencies in Yorkshire and the Humber (historic)
- United Kingdom constituency stubs


Wikimedia Foundation. 2010.