- North Shore (New Zealand electorate)
-
North Shore is a New Zealand Parliamentary electorate returning one Member of Parliament to the New Zealand House of Representatives. The current MP for North Shore is Wayne Mapp MP of the National Party.[1] He has held this position since 1996.
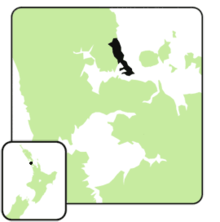
North Shore stretches up the eastern coast of North Shore City in Auckland, starting in the south at Devonport and moving northwards to take in Lake Pupuke and the suburbs of Takapuna, Westlake and Campbells Bay. North Shore is predominately New Zealand European, and has an average income high above the national average, boasting some of the most expensive real estate in the country.
The seat has been contested at every election in New Zealand since 1946, and notwithstanding a single victory by future Attorney-General Martyn Finlay in its first contest, has been safely held by the National Party ever since.
Contents
Members of Parliament for North Shore
Unless otherwise stated, all MPs terms began and started at general elections.
Name Party Elected Left Office Reason Martyn Finlay Labour 1946 1949 defeated Dean Eyre National 1949, 1951, 1954, 1957, 1960, 1963 1966 retired George Gair National 1966, 1969, 1972, 1975, 1978, 1981, 1984, 1987 1990 retired Bruce Cliffe1 National 1990, 1993 1996 retired Wayne Mapp National 1996, 1999, 2002, 2005, 2008 incumbent List MPs from North Shore
Members of Parliament elected from party lists in elections where that person also unsuccessfully contested the North Shore electorate. Unless otherwise stated, all MPs terms began and ended at general elections.
Name Party First Elected Left Office Contested North Shore Ann Batten2 NZ First 1996 1999 1996 Derek Quigley ACT 1996 1999 1996 Helen Duncan Labour 1998 2005 1999, 2002 Deborah Coddington ACT 2002 2005 2002 Phil Twyford Labour 2008 Current MP 2008 John Boscawen ACT 2008 Current MP 2008 1 Cliffe left the National Party in 1995 and represented the seat for the United Party until his retirement from politics in 1996 2 Batten deserted New Zealand First for Mauri Pacific in 1998
Election results
2008 election
General Election 2008: North Shore[2] Notes: Green background denotes the winner of the electorate vote.
Pink background denotes a candidate elected from their party list.
Yellow background denotes an electorate win by a list member.
A or
or  denotes status of any incumbent, win or lose respectively.
Party Candidate Votes % ±% Party Votes % ±% National  Wayne Mapp
23,824 61.85 - 22,738 58.06 Labour Phil Twyford 9,250 24.01 - 8,381 21.40 Green Pieter Watson 2,389 6.20 - 2,590 6.61 ACT John Boscawen 1,528 3.97 - 2,927 7.47 NZ First Joe Gregory 612 1.59 - 1,149 2.93 Family Party Louise Cleary 514 1.33 - 176 0.45 United Future Damian Light 261 0.68 - 370 0.94 Libertarianz Michael Murphy 94 0.24 - 33 0.08 RAM Stephen Cooper 47 0.12 - 13 0.03 Māori - 234 0.60 - Progressive - 165 0.42 - Bill and Ben - 139 0.35 - Legalise Cannabis - 104 0.27 - Kiwi - 83 0.21 - Alliance - 24 0.06 - Pacific - 13 0.03 - Workers Party - 10 0.03 - Democrats - 9 0.02 - RONZ - 4 0.01 - Informal votes 268 102 Total Valid votes 38,519 39,162 National hold Majority 14,574 2005 election
General Election 2005: North Shore[3] Notes: Green background denotes the winner of the electorate vote.
Pink background denotes a candidate elected from their party list.
Yellow background denotes an electorate win by a list member.
A or
or  denotes status of any incumbent, win or lose respectively.
Party Candidate Votes % ±% Party Votes % ±% National  Wayne Mapp
21,975 59.56 +15.58 20,125 53.49 +26.06 Labour Phil Twyford 12,274 33.26 +4.16 11,252 29.91 -1.36 United Future Ross Tizard 865 2.34 -1.54 807 2.14 -4.81 ACT Nick Kearney 835 2.26 -6.55 1144 3.04 -11.09 Progressive Paula Gillon 544 1.47 +0.61 261 0.69 -0.36 Māori Raewyn Harrison 265 0.72 - 106 0.28 - Libertarianz Michael Murphy 140 0.38 - 21 0.06 - Green - 1940 5.16 -1.28 NZ First - 1683 4.47 -5.70 Destiny - 120 0.32 - Legalise Cannabis - 55 0.15 -0.17 Christian Heritage - 53 0.14 -0.70 One NZ - 13 0.03 -0.02 99 MP - 11 0.03 - Alliance - 10 0.03 -0.78 Direct Democracy - 10 0.03 - Family Rights - 6 0.02 - Democrats - 5 0.01 - RONZ - 1 0.00 - Informal votes 430 90 Total Valid votes 36,898 37,623 National hold Majority 9701 26.30 +11.42 References
External links
- Electorate Profile Parliamentary Library
« historic electorates « Electorates of New Zealand at the 2008 and 2011 general elections North Island Auckland Central · Bay of Plenty · Botany · Coromandel · East Coast · East Coast Bays · Epsom · Hamilton East · Hamilton West · Helensville · Hunua · Hutt South · Mana · Māngere · Manukau East · Manurewa · Maungakiekie · Mount Albert · Mount Roskill · Napier · New Lynn · New Plymouth · North Shore · Northcote · Northland · Ōhariu · Ōtaki · Pakuranga · Palmerston North · Papakura · Rangitīkei · Rimutaka · Rodney · Rongotai · Rotorua · Tāmaki · Taranaki-King Country · Taupō · Tauranga · Te Atatū · Tukituki · Waikato · Wairarapa · Waitakere · Wellington Central · Whanganui · Whangarei
South Island Christchurch Central · Christchurch East · Clutha-Southland · Dunedin North · Dunedin South · Ilam · Invercargill · Kaikōura · Nelson · Port Hills · Rangitata · Selwyn · Waimakariri · Waitaki · West Coast-Tasman · Wigram
Māori Categories:- New Zealand electorates
- Politics of Auckland
Wikimedia Foundation. 2010.

