- Oregon's 4th congressional district
-
"OR-4" redirects here. For Oregon Route 4, see U.S. Route 97 in Oregon.
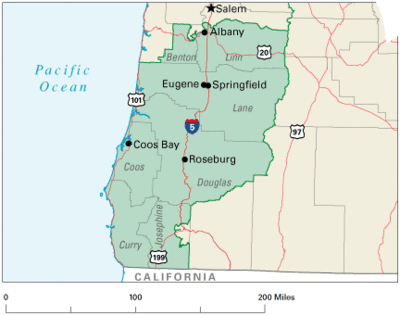
Oregon's 4th congressional district District map as of 2002 Current Representative Peter DeFazio (D–Springfield) Area 17,181 mi² (44,499 km²) Distribution 69.17% urban, 30.83% rural Population (2000) 684,280 Median income $35,796 Ethnicity 91.7% White, 0.5% Black, 1.5% Asian, 4.2% Hispanic, 0.2% Native American, 0.2% other Occupation 28.2% blue collar, 55.2% white collar, 16.5% gray collar Cook PVI D+2 Oregon's 4th congressional district represents the southern half of Oregon's coastal counties, including Coos, Curry, Douglas, Lane, and Linn counties and most of Benton and Josephine counties. It gained most of Josephine County from the 2nd district in the 2002 redistricting, but also lost most of the Grants Pass area to the second district.
The district has been represented by Democrat Peter A. DeFazio since 1987.
Contents
List of representatives
Representative Party Years District home Notes District created January 3, 1943 Harris Ellsworth Republican January 3, 1943 – January 3, 1957 Roseburg Charles O. Porter Democratic January 3, 1957 – January 3, 1961 Eugene Edwin R. Durno Republican January 3, 1961 – January 3, 1963 Medford Robert B. Duncan Democratic January 3, 1963 – January 3, 1967 Medford John R. Dellenback Republican January 3, 1967 – January 3, 1975 Medford James H. Weaver Democratic January 3, 1975 – January 3, 1987 Eugene Peter A. DeFazio Democratic January 3, 1987 – present Springfield Incumbent Election results
Sources (official results only):
- Elections History from the Oregon Secretary of State website
- Election Statistics from the website of the Clerk of the United States House of Representatives
2010
See also: United States House of Representatives elections in Oregon, 2010United States House election, 2010: Oregon District 4 Party Candidate Votes Percentage Democratic Peter DeFazio 162,416 54.49% Republican Art Robinson 129,877 43.58% Pacific Green Mike Beilstein 5,215 1.75% Misc. Misc. 544 1.83% 2008
United States House election, 2008: Oregon District 4 Party Candidate Votes Percentage Democratic Peter DeFazio 275,143 82.34% Constitution Jaynee Germond 43,133 12.91% Pacific Green Mike Beilstein 13,162 3.94% Misc. Misc. 2,708 0.81% 2006
United States House election, 2006: Oregon District 4 Party Candidate Votes Percentage Democratic Peter DeFazio 180,607 62.23% Republican Jim Feldkamp 109,105 37.59% Misc. Misc. 532 0.18% 2004
United States House election, 2004: Oregon District 4 Party Candidate Votes Percentage Democratic Peter DeFazio 228,611 60.98% Republican Jim Feldkamp 140,882 37.58% Libertarian Jacob Boone 3,190 0.85% Constitution Michael Paul Marsh 1,799 0.48% Misc. Misc. 427 0.01% 2002
United States House election, 2002: Oregon District 4 Party Candidate Votes Percentage Democratic Peter DeFazio 168,150 63.86% Republican Liz VanLeeuwen 90,523 34.36% Libertarian Chris Bigelow 4,602 1.75% Misc. Misc. 206 0.01% 2000
United States House election, 2000: Oregon District 4 Party Candidate Votes Percentage Democratic Peter DeFazio 197,998 68.03% Republican John Lindsey 88,950 30.56% Socialist David Duemler 3,696 1.27% Misc. Misc. 421 0.14% 1998
United States House election, 1998: Oregon District 4 Party Candidate Votes Percentage Democratic Peter DeFazio 157,524 70.12% Republican Steve J. Webb 64,143 28.55% Socialist Karl G. Sorg 2,694 1.20% Misc. Misc. 276 0.12% 1996
United States House election, 1996: Oregon District 4 Party Candidate Votes Percentage Democratic Peter DeFazio 177,270 65.69% Republican John D. Newkirk 76,649 28.40% Libertarian Tonie Nathan 4,919 1.82% Reform Bill Bonville 3,960 1.47% Socialist David Duemler 1,373 0.51% Peace and Freedom Alan Opus 1,311 0.49% Misc. Misc. 4,374 1.62% References
- Martis, Kenneth C. (1989). The Historical Atlas of Political Parties in the United States Congress. New York: Macmillan Publishing Company.
- Martis, Kenneth C. (1982). The Historical Atlas of United States Congressional Districts. New York: Macmillan Publishing Company.
- Congressional Biographical Directory of the United States 1774–present
Oregon's congressional districts All districts: Territory At-large 1 2 3 4 5
The At-large and territorial districts are obsolete.
See also: Oregon's past & present Representatives, Senators, and Delegations, 2010 elections, 2012 elections
All U.S. districts – Apportionment – Redistricting – Gerrymandering – MapsCategories:
Wikimedia Foundation. 2010.

