- Oregon's 1st congressional district
-
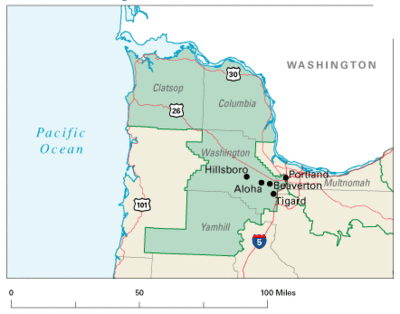
Oregon's 1st congressional district District map as of 2002 Current Representative vacant Area 2,941 mi² (7,617 km²) Distribution 86.65% urban, 13.35% rural Population (2000) 684,280 Median income $48,464 Ethnicity 84.9% White, 1.2% Black, 5.1% Asian, 9.4% Hispanic, 0.2% Native American, 0.3% other Occupation 21.8% blue collar, 65.3% white collar, 12.9% gray collar Cook PVI D+8 Oregon's 1st congressional district consists of the northwest corner of Oregon. It includes Clatsop, Columbia, Washington, and Yamhill counties, and southwest Portland, part of Multnomah County, which belonged to the 3rd district before the 2002 redistricting.
The district had been represented by Democrat David Wu since 1999, but Wu resigned from his seat on August 3, 2011 in the wake of accusations of sexual misconduct.[1] A special election has been called for January 31, 2012, with party primaries to occur beforehand on November 8, 2011.[2]
Contents
List of representatives
Representative Party Years District home Notes District created March 4, 1893 Binger Hermann Republican March 4, 1893 – March 3, 1897 Roseburg Redistricted from At-large district Thomas H. Tongue Republican March 4, 1897 – January 11, 1903 Hillsboro Died Vacant January 11, 1903 – June 1, 1903 Binger Hermann Republican June 1, 1903 – March 3, 1907 Roseburg Willis C. Hawley Republican March 4, 1907 – March 3, 1933 Salem James W. Mott Republican March 4, 1933 – November 12, 1945 Salem Died Vacant November 12, 1945 – January 18, 1946 A. Walter Norblad Republican January 18, 1946 – September 20, 1964 Astoria
StaytonDied Vacant September 20, 1964 – November 3, 1964 Wendell Wyatt Republican November 3, 1964 – January 3, 1975 Astoria
GearhartLes AuCoin Democratic January 3, 1975 – January 3, 1993 Forest Grove
PortlandElizabeth Furse Democratic January 3, 1993 – January 3, 1999 Hillsboro David Wu Democratic January 3, 1999 – August 3, 2011 Portland Resigned Vacant August 3, 2011 – Present Election results
Sources (official results only):
- Elections History from the Oregon Secretary of State website
- Election Statistics from the website of the Clerk of the United States House of Representatives
2010
See also: United States House of Representatives elections in Oregon, 2010United States House election, 2010: Oregon District 1 Party Candidate Votes Percentage Democratic David Wu 160,357 54.7% Republican Rob Cornilles 122,858 41.9% Constitution Don LaMunyon 3,855 1.32% Pacific Green Chris Henry 2,955 1.01% Libertarian H. Joe Tabor 2,492 0.85% Misc. Misc. 392 0.13% 2008
United States House election, 2008: Oregon District 1 Party Candidate Votes Percentage Democratic David Wu 237,567 72.6% Independent Joel Haugen 58,279 17.7% Constitution Scott Semrau 14,172 4.27% Libertarian H. Joe Tabor 10,992 3.31% Pacific Green Chris Henry 7,128 2.14% Misc. Misc. 4,110 1.23% 2006
United States House election, 2006: Oregon District 1 Party Candidate Votes Percentage Democratic David Wu 169,409 62.83% Republican Derrick Kitts 90,904 33.71% Libertarian Drake Davis 4,497 1.67% 2004
United States House election, 2004: Oregon District 1 Party Candidate Votes Percentage Democratic David Wu 203,771 57.51% Republican Goli Ameri 135,164 38.15% Constitution Dean Wolf 13,882 3.91% Misc. Misc. 1,521 0.43% 2002
United States House election, 2002: Oregon District 1 Party Candidate Votes Percentage Democratic David Wu 149,215 62.69% Republican Jim Greenfield 80,917 33.99% Libertarian Beth A. King 7,639 3.21% Misc. Misc. 265 0.11% 2000
United States House election, 2000: Oregon District 1 Party Candidate Votes Percentage Democratic David Wu 176,902 58.28% Republican Charles Starr 115,303 37.99% Libertarian Beth A. King 10,858 3.58% Misc. Misc. 458 0.15% 1998
United States House election, 1998: Oregon District 1 Party Candidate Votes Percentage Democratic David Wu 119,993 50.10% Republican Molly Bordonaro 112,827 47.11% Libertarian Michael De Paulo 4,218 1.76% Socialist John F. Hryciuk 2,224 0.93% Misc. Misc. 234 0.10% 1996
United States House election, 1996: Oregon District 1 Party Candidate Votes Percentage Democratic Elizabeth Furse 144,588 51.90% Republican Bill Witt 126,146 45.28% Libertarian Richard Johnson 6,310 2.26% Socialist David Princ 1,146 0.41% Misc. Misc. 414 0.15% References
- Martis, Kenneth C. (1989). The Historical Atlas of Political Parties in the United States Congress. New York: Macmillan Publishing Company.
- Martis, Kenneth C. (1982). The Historical Atlas of United States Congressional Districts. New York: Macmillan Publishing Company.
- Congressional Biographical Directory of the United States 1774–present
Oregon's congressional districts All districts: Territory At-large 1 2 3 4 5
The At-large and territorial districts are obsolete.
See also: Oregon's past & present Representatives, Senators, and Delegations, 2010 elections, 2012 elections
All U.S. districts – Apportionment – Redistricting – Gerrymandering – MapsCategories:- Congressional districts of Oregon
- Clatsop County, Oregon
- Columbia County, Oregon
- Multnomah County, Oregon
- Washington County, Oregon
- Yamhill County, Oregon
Wikimedia Foundation. 2010.

