- North West Leicestershire District Council election, 2007
-
Elections to North West Leicestershire District Council took place on 3rd May 2007[1], with the previous election taking place in 2003 and with the next to be held on 5th May 2011. The election took place across all 20 electoral wards and a total of 38 councillors were elected. This election was a landslide win for the Conservatives who gained an absolute majority in the council for the first time since its creation in 1973.
Contents
Results
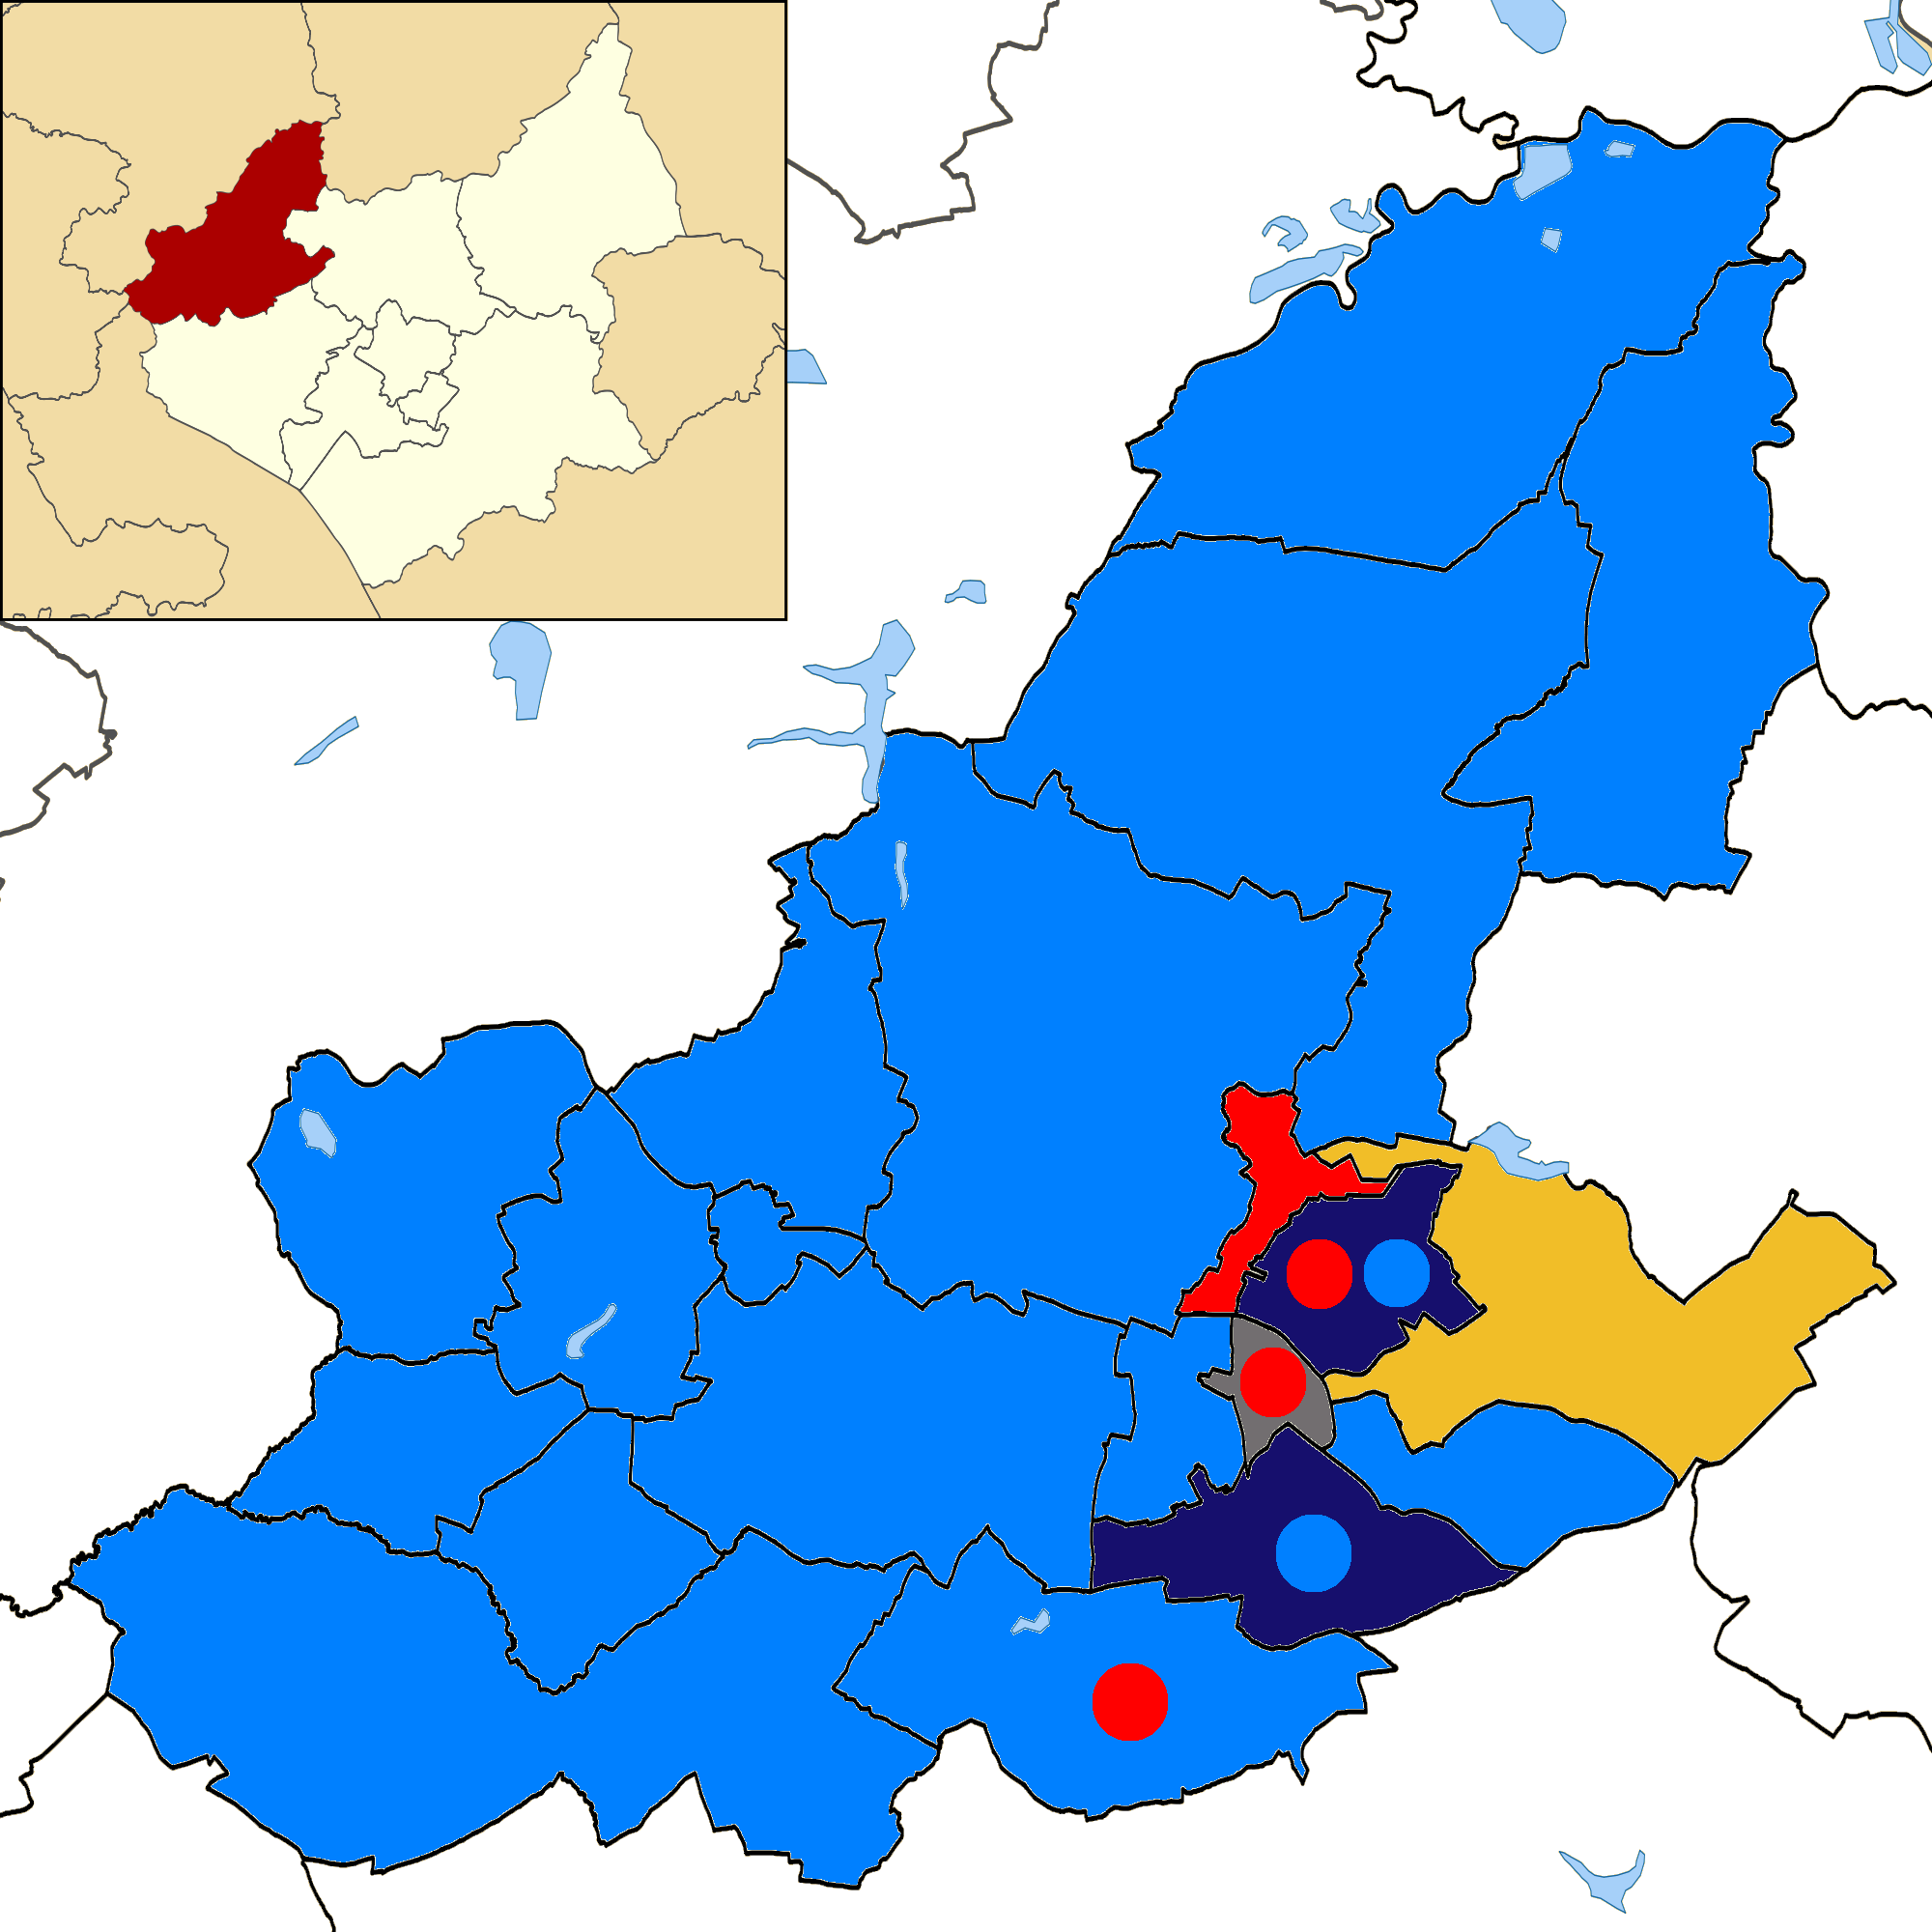
 A map of North West Leicestershire coloured by victorious party at the 2007 District Council election. Coloured dots show mixed partisan representation within a ward.
North West Leicestershire District Council election, 2007 Party Seats Gains Losses Net gain/loss Seats % Votes % Votes +/- Conservative 27 15 0 +15 71.1 45.3 24,670 +13.4 Labour 5 1 16 −15 13.2 31.4 17,097 −19.2 Liberal Democrat 3 0 1 −1 7.9 14.4 7,839 +1.0 BNP 2 2 0 +2 5.3 4.9 2,665 N/A Independent 1 0 1 −1 2.6 3.2 1,734 −0.9 UKIP 0 0 0 ±0 0 0.8 411 N/A Ward results
In wards that are represented by more than one councillor, electors were given more than one vote each, hence the voter turnout may not match the number of votes cast.
Appleby (1 seat) Party Candidate Votes % ±% Conservative Richard Blunt 722 77.5 +5.2 Labour Maureen Palmer 210 22.5 −5.2 Turnout 932 Conservative hold Swing Ashby Castle (1 seat) Party Candidate Votes % ±% Conservative John Geoffrey Coxon 633 66.5 −6.6 Labour Gerry Pointon 167 17.5 −9.4 Liberal Democrat Michael Geoffrey Cort 152 16.0 N/A Turnout 952 Conservative hold Swing Ashby Holywell (2 seats) Party Candidate Votes % ±% Conservative Roger David Bayliss 668 25.6 +3.8 Conservative Graham Arthur Allman 583 22.3 +4.4 Labour Martin Hilary Mabey 383 14.7 −3.1 Labour Gordon Tacey 351 13.4 −6.4 Liberal Democrat David John Price 320 12.3 +0.4 Liberal Democrat Geoffrey Ronald Cort 307 11.7 +0.8 Turnout 1,306 Conservative hold Swing Conservative gain from Labour Swing Ashby Ivanhoe (2 seats) Party Candidate Votes % ±% Conservative James Hoult 905 28.6 +6.3 Conservative David Geraint Jones 883 27.9 +5.5 Labour David Paul Whetton 603 19.1 −10.1 Labour Sean David Sheahan 507 16.0 −10.0 Liberal Democrat Lee James Windram 265 8.4 N/A Turnout 1,582 Conservative gain from Labour Swing Conservative gain from Labour Swing Bardon (1 seat) Party Candidate Votes % ±% Conservative Ted Purver 388 57.1 −4.6 Labour Rodney Peter Storer 170 25.0 −13.3 Liberal Democrat Sheila Maureen Wyatt 122 17.9 N/A Turnout 680 Conservative hold Swing Breedon (1 seat) Party Candidate Votes % ±% Conservative Nicholas James Rushton 729 80.2 +11.7 Labour Yvonne Smith 180 19.8 +5.6 Turnout 909 Conservative hold Swing Castle Donington (3 seats) Party Candidate Votes % ±% Conservative Gerald Dalby 1360 24.5 +4.3 Conservative Tony Saffell 1243 22.4 +5.5 Conservative Charles Meynell 1087 19.6 +3.3 Labour Derek Henry Wintle 734 13.2 −4.5 Labour Patrick David Lynch 679 12.3 −2.8 Labour Robert Allan Haskins 442 8.0 −5.7 Turnout 1,848 Conservative hold Swing Conservative gain from Labour Swing Conservative hold Swing Coalville (2 seats) Party Candidate Votes % ±% Independent Philip Holland 509 23.8 −4.6 Labour John Legrys 501 23.4 −0.6 BNP Sean Martyn Lee 483 22.6 N/A Conservative Rebecca Harding 325 15.2 N/A Conservative Paul Richard Oakden 321 15.0 N/A Turnout 1,069 Independent hold Swing Labour gain from Independent Swing Greenhill (3 seats) Party Candidate Votes % ±% Liberal Democrat Michael Barry Wyatt 873 13.9 −8.5 Liberal Democrat Julie Anne Roberts 749 11.9 −6.3 Liberal Democrat Dominic John McGill 713 11.4 −7.1 Labour Jim Collins 601 9.6 −5.2 Labour Adi Freeman 541 8.6 −5.1 BNP Gavin Sharpe 515 8.2 N/A Conservative Keith Merrie 472 7.5 N/A Labour Jim Roberts 470 7.5 −4.9 Conservative Paul Bridgen 468 7.5 N/A Independent Adoline Uvenia Smith 446 7.1 N/A Conservative John Turnbull Kailofer 424 6.8 N/A Turnout 2,091 Liberal Democrat hold Swing Liberal Democrat hold Swing Liberal Democrat hold Swing Hugglescote (2 seats) Party Candidate Votes % ±% BNP Graham Ronald Partner 449 16.1 N/A Conservative Matthew John Blain 410 14.7 N/A Labour Steven John Peace 355 12.7 −23.4 Labour Paul Anthony Hyde 329 11.8 −25.7 Conservative Sudesh Mattu 290 10.4 N/A Liberal Democrat Lesley Bowler 273 9.8 −16.6 Liberal Democrat David Perrins 267 9.6 N/A Independent Matt Pollard 217 7.8 N/A Independent Fred Harris 196 7.0 N/A Turnout 1,393 BNP gain from Labour Swing Conservative gain from Labour Swing Ibstock and Heather (3 seats) Party Candidate Votes % ±% Conservative Craig Bowley 737 15.3 ±0.0 Conservative Ted Blunt 731 15.2 +0.2 Labour Dai Male 707 14.7 −8.1 Labour Penny Hopkins 620 12.9 −10.8 Conservative Mary Powell 599 12.5 N/A Labour Ray Merry 559 11.6 −11.2 UKIP Adam Rowland Tilbury 411 8.5 N/A Liberal Democrat Leighanna Marie Littlejohn 225 4.7 N/A Liberal Democrat Ben Alan Roberts 222 4.6 N/A Turnout 1,604 Conservative gain from Labour Swing Conservative gain from Labour Swing Labour hold Swing Kegworth and Whatton (2 seats) Party Candidate Votes % ±% Conservative Trevor Pendleton 1011 46.5 +8.8 Conservative Alison Smith 736 33.9 +4.1 Labour Lawrence Heap 427 19.6 +3.2 Turnout 1,087 Conservative hold Swing Conservative hold Swing Measham (2 seats) Party Candidate Votes % ±% Conservative Rowena Emma Holland 548 24.1 −2.9 Conservative Dickie Hunt 538 23.6 N/A Labour John Lewis 481 21.1 −21.4 Labour Tom Neilson 468 20.6 −9.9 Liberal Democrat Alexander Joseph Hugh Longdon 241 10.6 N/A Turnout 1,138 Conservative gain from Labour Swing Conservative gain from Labour Swing Moira (2 seats) Party Candidate Votes % ±% Conservative Annette Bridges 794 27.9 +3.2 Conservative John Bridges 755 26.5 N/A Labour Eddie Palmer 651 22.8 −13.5 Labour Patrick John Regan 650 22.8 −16.2 Turnout 1,425 Conservative gain from Labour Swing Conservative gain from Labour Swing Oakthorpe and Donisthorpe (1 seat) Party Candidate Votes % ±% Conservative Jackie Bridgen 441 55.0 N/A Labour Glynn John Davies 361 45.0 −15.7 Turnout 802 Conservative gain from Labour Swing Ravenstone and Packington (1 seat) Party Candidate Votes % ±% Conservative Nigel Smith 560 50.0 −6.0 Independent Virge Richichi 366 32.7 N/A Labour George Arthur Botterill 193 17.3 −26.7 Turnout 1,119 Conservative hold Swing Snibston (2 seats) Party Candidate Votes % ±% Conservative Paula Diana Purver 595 24.9 −0.6 Conservative Christopher Timmis 525 21.9 N/A Labour Alison Jane Cooper 487 20.4 −5.5 Labour John Geary 482 20.2 −8.1 Liberal Democrat Colin Pickering 301 12.6 N/A Turnout 1,195 Conservative gain from Labour Swing Conservative gain from Labour Swing Thringstone (2 seats) Party Candidate Votes % ±% Labour Pam Clayfield 634 23.0 −0.7 Labour David Burton Everitt 564 20.4 −4.4 Conservative Clare Louise Blain 501 18.1 +10.0 Conservative Yvo Henniker-Heaton 376 13.6 N/A Liberal Democrat Shane David Bowler 355 12.9 −10.4 Liberal Democrat Darren James Finney 331 12.0 −8.2 Turnout 1,381 Labour hold Swing Labour hold Swing Valley (2 seats) Party Candidate Votes % ±% Conservative David John Stevenson 958 31.8 −3.3 Conservative Barry Webster 928 30.8 −2.4 Liberal Democrat Nicola Timmins 342 11.4 N/A BNP Daniel Nathan Woolcock 296 9.8 N/A Labour Patricia Jeannine Underwood 284 9.4 −7.5 Labour Corinne Male 206 6.8 −8.0 Turnout 1,507 Conservative hold Swing Conservative hold Swing Whitwick (3 seats) Party Candidate Votes % ±% BNP Ian Meller 922 14.3 N/A Labour Derek Howe 839 13.0 −18.0 Conservative Tony Gillard 712 11.1 N/A Labour Ray Woodward 699 10.8 −14.2 Liberal Democrat Ann Edwards 644 10.0 N/A Liberal Democrat Daniel Leslie Bowler 574 8.9 N/A Liberal Democrat David James Wyatt 563 8.7 −14.3 Labour Steve Preston 562 8.7 −12.3 Conservative David Russell Ruck 500 7.8 N/A Conservative Sandra Mary Ruck 429 6.7 N/A Turnout 2,148 BNP gain from Labour Swing Labour hold Swing Conservative gain from Liberal Democrat Swing References
- ^ North West Leicestershire District Council election, 2007 results, North West Leicestershire District Council website
See also
Preceded by
North West Leicestershire District Council election, 2003North West Leicestershire local elections Succeeded by
North West Leicestershire District Council election, 2011(2006 ←)  United Kingdom local elections, 2007 (→ 2008)
Metropolitan boroughs Barnsley · Birmingham · Bolton · Bradford · Bury · Calderdale · Coventry · Doncaster · Dudley · Gateshead · Kirklees · Knowsley · Leeds · Liverpool · Manchester · Newcastle upon Tyne · North Tyneside · Oldham · Rochdale · Rotherham · Salford · Sandwell · Sefton · Sheffield · Solihull · South Tyneside · St Helens · Stockport · Sunderland · Tameside · Trafford · Wakefield · Walsall · Wigan · Wirral · WolverhamptonUnitary authorities Bath and North East Somerset · Blackburn with Darwen · Blackpool · Bournemouth · Bracknell Forest · Brighton & Hove · Bristol · Darlington · Derby · East Riding of Yorkshire · Halton · Hartlepool · Herefordshire · Kingston upon Hull · Leicester · Luton · Medway · Middlesbrough · Milton Keynes · North East Lincolnshire · North Lincolnshire · North Somerset · Nottingham · Peterborough · Plymouth · Poole · Portsmouth · Reading · Redcar and Cleveland · Rutland · Slough · South Gloucestershire · Southampton · Southend-on-Sea · Stockton-on-Tees · Stoke-on-Trent · Swindon · Telford and Wrekin · Thurrock · Torbay · Warrington · West Berkshire · Windsor and Maidenhead · Wokingham · YorkDistrict councils Allerdale · Alnwick · Amber Valley · Arun · Ashfield · Ashford · Aylesbury Vale · Babergh · Barrow-in-Furness · Basildon · Basingstoke and Deane · Bassetlaw · Bedford · Berwick-upon-Tweed · Blaby · Blyth Valley · Bolsover · Boston · Braintree · Breckland · Brentwood · Bridgnorth · Broadland · Bromsgrove · Broxbourne · Broxtowe · Burnley · Cambridge · Cannock Chase · Canterbury · Caradon · Carlisle · Carrick · Castle Point · Castle Morpeth · Charnwood · Chelmsford · Cherwell · Chester · Chester-le-Street · Chesterfield · Chichester · Chiltern · Christchurch · Chorley · Colchester · Congleton · Copeland · Corby · Cotswold · Craven · Crawley · Crewe and Nantwich · Dacorum · Dartford · Daventry · Derbyshire Dales · East Hampshire · Eastleigh · Ellesmere Port and Neston · Elmbridge · Epping Forest · Exeter · Fenland · Fylde · Gedling · Gloucester · Guildford · Gravesham · Great Yarmouth · Harlow · Harrogate · Hart · Havant · Hertsmere · High Peak · Huntingdonshire · Hyndburn · Ipswich · Kettering · Lancaster · Macclesfield · Maidstone · Mole Valley · Newcastle-under-Lyme · North Devon · North West Leicestershire · Northampton · Norwich · Nuneaton and Bedworth · Pendle · Penwith · Preston · Purbeck · Redditch · Reigate and Banstead · Rochford · Rossendale · Rugby · Runnymede · Rushmoor · Ryedale · Scarborough · Sedgefield · Shepway · Shrewsbury and Atcham · South Bedfordshire · South Cambridgeshire · South Lakeland · South Ribble · St Albans · Stevenage · Stratford-on-Avon · Stroud · Swale · Tamworth · Tandridge · Three Rivers · Tonbridge and Malling · Tunbridge Wells · Tynedale · Warwick · Watford · Waveney · Welwyn Hatfield · West Lancashire · West Lindsey · West Oxfordshire · West Wiltshire · Weymouth and Portland · Winchester · Woking · Worcester · Worthing · Wyre · Wyre ForestScottish councils Aberdeen · Aberdeenshire · Angus · Argyll and Bute · Clackmannanshire · Dumfries and Galloway · Dundee City · East Ayrshire · East Dunbartonshire · East Lothian · East Renfrewshire · Edinburgh · Falkirk · Fife · Glasgow · Highland · Inverclyde · Midlothian · Moray · Comhairle nan Eilean Siar · North Ayrshire · North Lanarkshire · Orkney · Perth and Kinross · Renfrewshire · Scottish Borders · Shetland · South Ayrshire · South Lanarkshire · Stirling · West Dunbartonshire · West LothianCategories:- North West Leicestershire
- Council elections in Leicestershire
- Council elections in the East Midlands
Wikimedia Foundation. 2010.