- North West Leicestershire District Council election, 2011
-
Elections to the North West Leicestershire District Council took place on May 5th 2011[1], in line with other local elections in the United Kingdom. A total of 38 councillors were elected from 20 wards as the whole council is up for election.
The Conservatives held control of the council after winning it in a landslide at the previous election. The Labour Party failed to retake control of the council but made significant gains at the expense of the Conservatives, who lost 6 councillors, the Liberal Democrats, who lost 2 councillors, the BNP, who lost both of their councillors, and one Independent.
Contents
Results
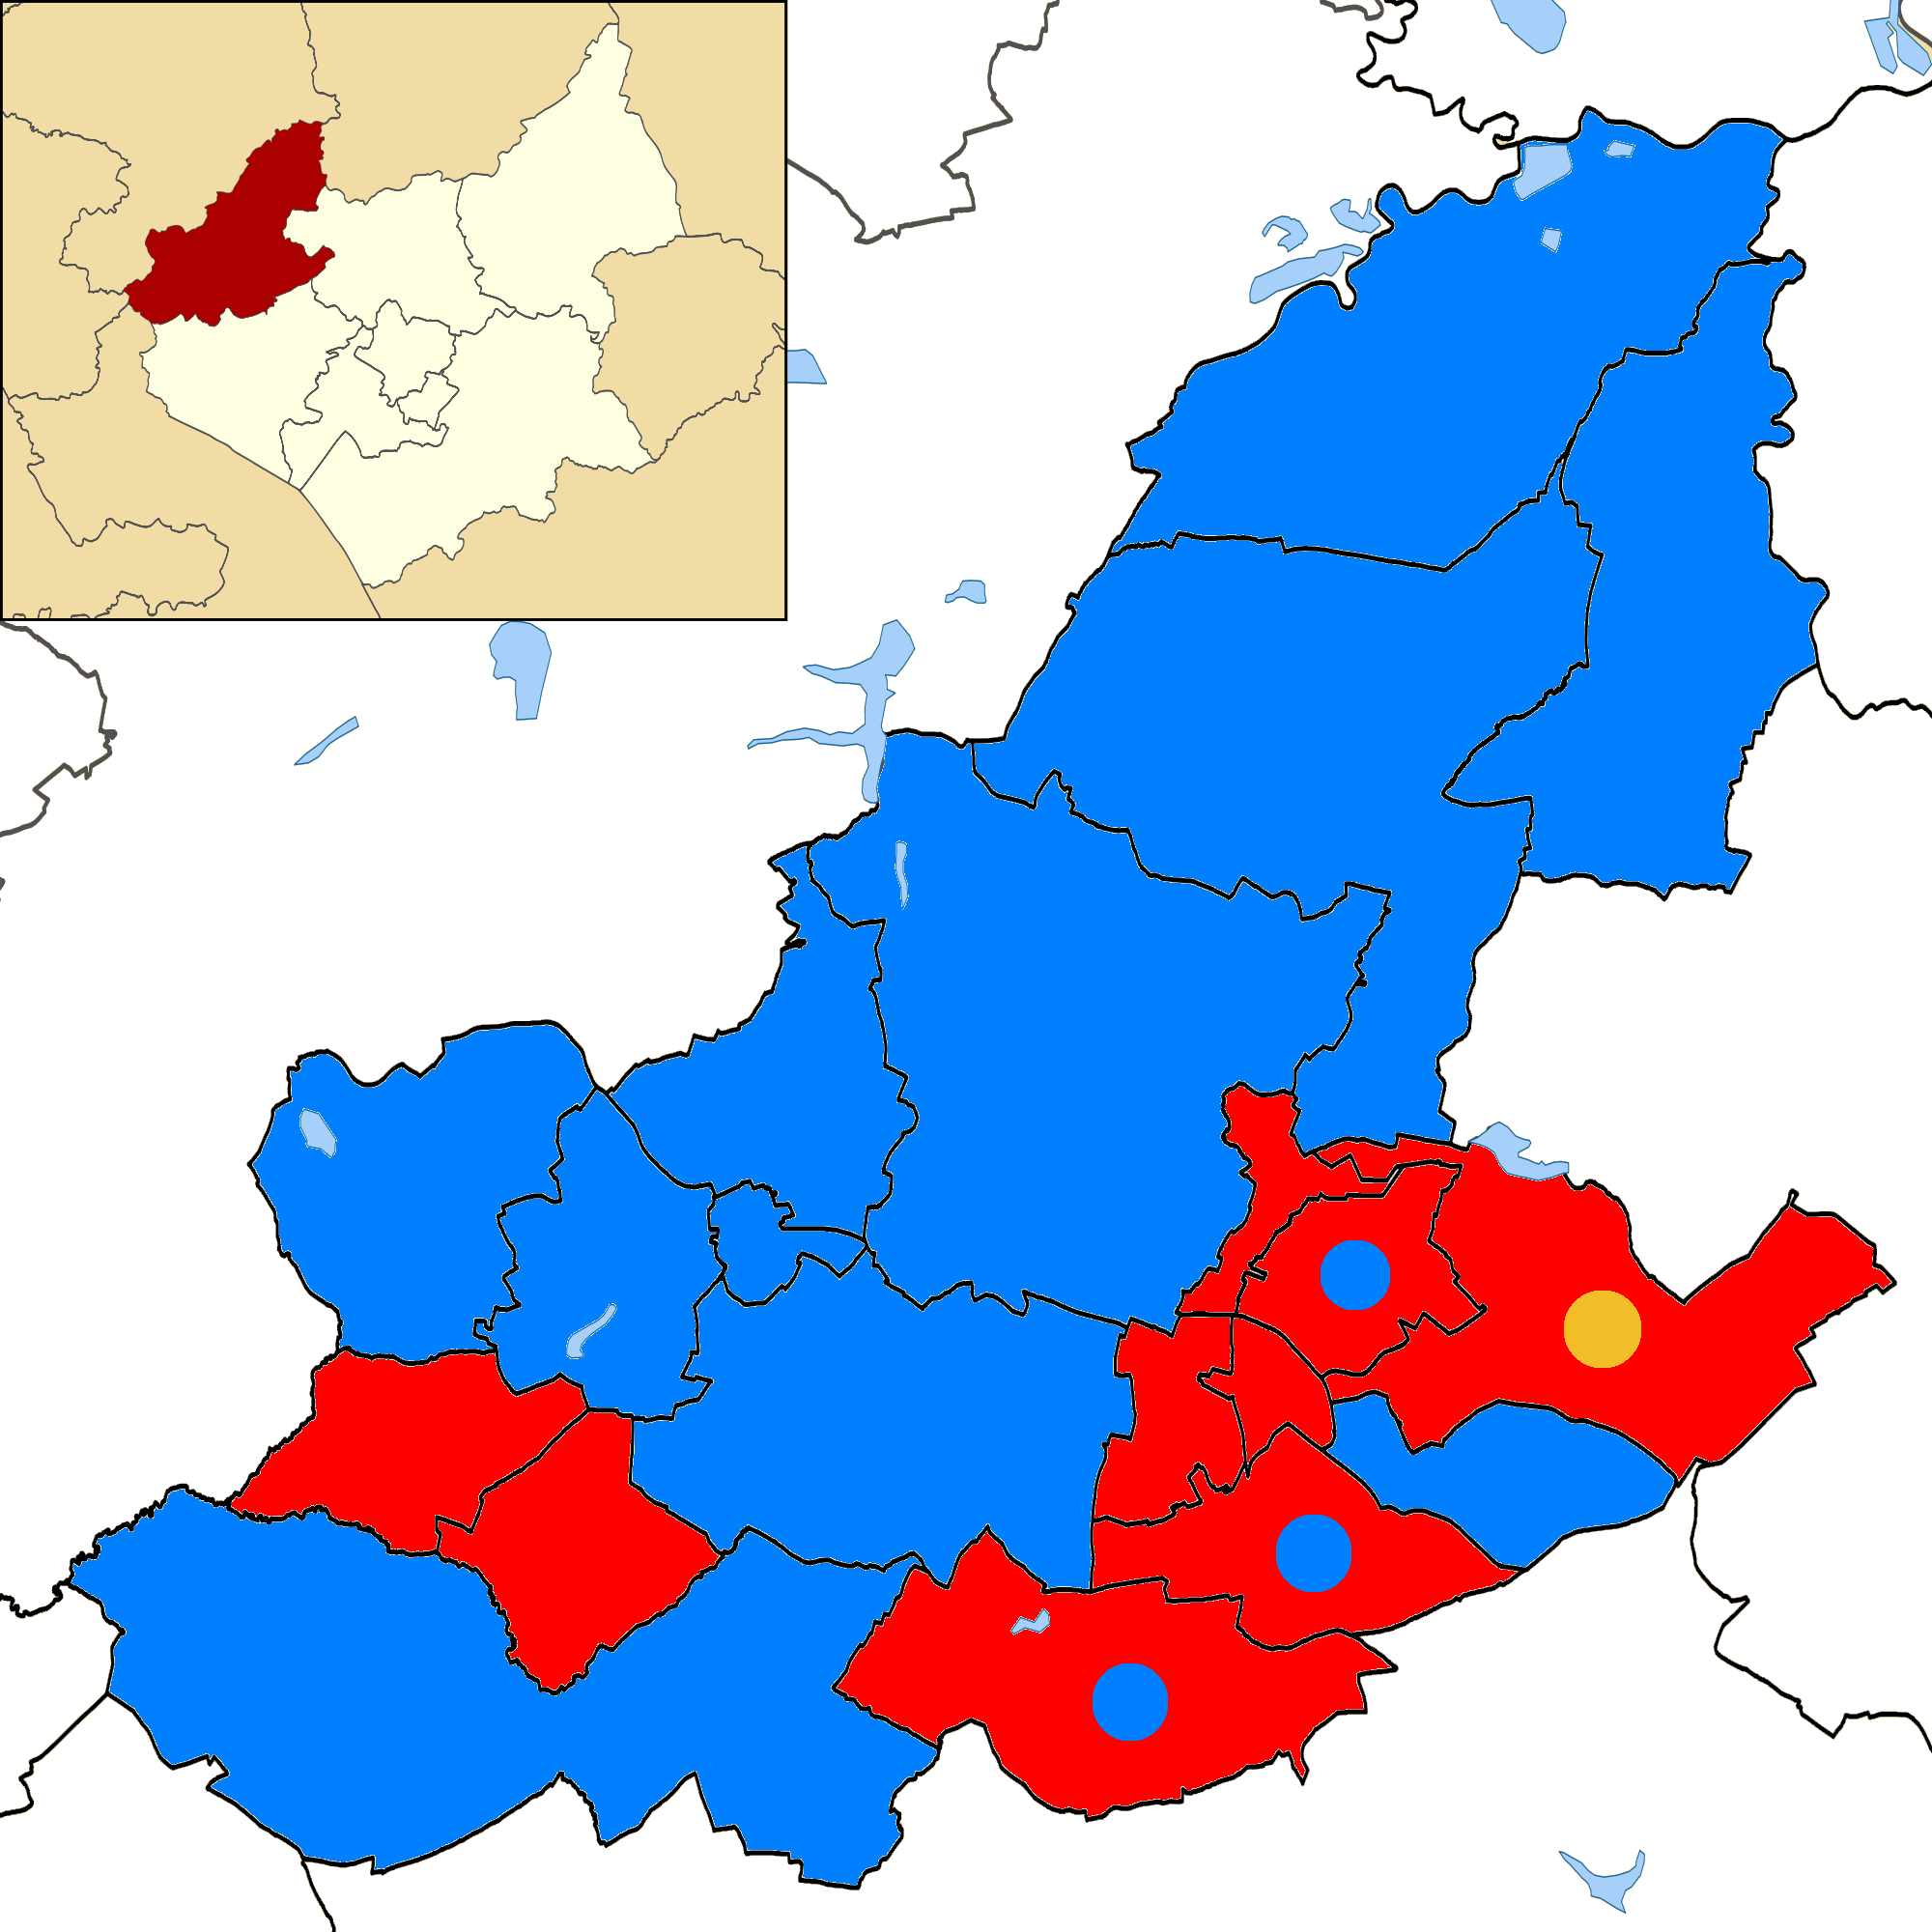
 A map of North West Leicestershire coloured by victorious party at the 2011 District Council election. Coloured dots show mixed partisan representation within a ward.
North West Leicestershire District Council election, 2011 Party Seats Gains Losses Net gain/loss Seats % Votes % Votes +/- Conservative 21 0 6 −6 55.3 46.5 27,214 +1.2 Labour 16 11 0 +11 42.1 38.7 22,632 +7.3 Liberal Democrat 1 0 2 −2 2.6 8.8 5,149 −5.6 Independent 0 0 1 −1 0.0 4.2 2,475 +1.0 BNP 0 0 2 −2 0.0 1.1 616 −3.8 Green 0 0 0 ±0 0.0 0.7 404 N/A Ward results
In wards that are represented by more than one councillor, electors were given more than one vote each, hence the voter turnout may not match the number of votes cast.
Appleby (1 seat) Party Candidate Votes % ±% Conservative Richard Blunt 620 56.3 −21.2 Independent Colin Roberts 302 27.4 N/A Labour Co-op Gordon Tacey 179 16.3 −6.2 Turnout 1,101 62.2 Conservative hold Swing Ashby Castle (1 seat) Party Candidate Votes % ±% Conservative John Geoffrey Coxon 810 71.5 +5.0 Labour Gerry Pointon 323 28.5 +11.0 Turnout 1,133 55.4 Conservative hold Swing Ashby Holywell (2 seats) Party Candidate Votes % ±% Conservative Roger David Bayliss 907 29.7 +4.1 Conservative Graham Arthur Allman 817 26.8 +4.5 Labour Eric Avins 679 22.2 +7.5 Labour Stephen Whetton 650 21.3 +7.9 Turnout 1,526 43.8 Conservative hold Swing Conservative hold Swing Ashby Ivanhoe (2 seats) Party Candidate Votes % ±% Conservative James Hoult 952 28.2 −0.4 Conservative Geraint Jones 929 27.5 −0.4 Labour Mick Newborough 784 23.2 +4.1 Labour David Whetton 714 21.1 +5.1 Turnout 1,688 49.3 Conservative hold Swing Conservative hold Swing Bardon (1 seat) Party Candidate Votes % ±% Conservative Michael Specht 296 33.4 −23.7 Liberal Democrat David Wyatt 276 31.2 +13.3 Labour Rodney Storer 244 27.6 +2.6 Green Sue Morrell 69 7.8 N/A Turnout 885 36.9 Conservative hold Swing Breedon (1 seat) Party Candidate Votes % ±% Conservative Nicholas James Rushton 568 52.3 −27.9 Independent Barry Webster 293 27.0 N/A Labour Laurie Andrade 163 15.0 −4.8 Liberal Democrat Shane Bowler 62 5.7 N/A Turnout 1,086 54.6 Conservative hold Swing Castle Donington (3 seats) Party Candidate Votes % ±% Conservative Tony Saffell 1,310 20.9 −1.5 Conservative Caroline Large 1,120 17.9 −6.6 Conservative Charles Meynell 1,051 16.8 −2.8 Labour Derek Wintle 993 15.9 +2.7 Labour Patrick Lynch 881 14.1 +1.8 Labour Robert Haskins 626 10.0 +2.0 Liberal Democrat Alan Turner 278 4.4 N/A Turnout 2,086 44.0 Conservative hold Swing Conservative hold Swing Conservative hold Swing Coalville (2 seats) Party Candidate Votes % ±% Labour John Legrys 665 34.4 +11.0 Labour Pam Clayfield 595 30.8 N/A Conservative Paul Bridgen 371 19.2 +4.0 Independent Philip Holland 370 19.2 −4.6 Conservative Leah Miller 301 15.6 +0.6 Independent Ann Edwards 222 11.5 N/A Turnout 966 35.3 Labour gain from Independent Swing Labour hold Swing Greenhill (3 seats) Party Candidate Votes % ±% Labour Ronnie Adams 800 13.3 +3.7 Liberal Democrat Michael Barry Wyatt 783 13.0 −0.9 Labour Nick Clarke 763 12.7 +4.1 Labour Dave De Lacy 674 11.2 +3.7 Conservative Gillian Hoult 611 10.2 +2.7 Liberal Democrat Lesley Bowler 557 9.3 −2.1 Liberal Democrat Julie Anne Roberts 546 9.1 −2.8 Conservative John Turnbull Kailofer 533 8.9 +2.1 Conservative Mary Tuckey 533 8.9 +1.4 Green Terry Morrell 216 3.6 N/A Independent Jim Collins 174 2.9 N/A Turnout 2,005 43.9 Labour gain from Liberal Democrat Swing Liberal Democrat hold Swing Labour gain from Liberal Democrat Swing Hugglescote (2 seats) Party Candidate Votes % ±% Labour Paul Anthony Hyde 484 18.3 +6.5 Conservative John Cotterill 440 16.7 +2.0 Labour Lauren Otter 437 16.5 +3.8 Conservative Matthew Pollard 331 12.5 +2.1 Independent Graham Partner 270 10.2 −5.9 Independent Steve Palmer 252 9.5 N/A Nonpartisan Alan Gamble 172 6.5 N/A Green Penny Wakefield 119 4.5 N/A Liberal Democrat Nigel Adcock 74 2.8 −7.0 Liberal Democrat Jamie Dennis 62 2.3 −7.3 Turnout 1,320 41.8 Labour gain from BNP Swing Conservative hold Swing Ibstock and Heather (3 seats) Party Candidate Votes % ±% Conservative Virge Richichi 970 17.8 +2.5 Labour Stacy Harris 748 13.7 −1.0 Labour Janet Ruff 693 12.7 −0.2 Labour Gerald Wilkinson 685 12.6 +0.1 Conservative Neville Drury 648 11.9 −3.3 Conservative Colin Tracey 612 11.2 −1.3 Independent Ivan Hammonds 420 7.7 N/A Liberal Democrat Kim Wyatt 355 6.5 +1.8 Liberal Democrat Barrie Catchpole 161 3.0 −1.6 Liberal Democrat Darren Finney 156 2.9 N/A Turnout 1,816 40.1 Conservative hold Swing Labour gain from Conservative Swing Labour hold Swing Kegworth and Whatton (2 seats) Party Candidate Votes % ±% Conservative Trevor Pendleton 1,111 45.4 −1.1 Conservative Alison Smith 761 31.1 −2.8 Labour Co-op Christopher Smith 576 23.5 +3.9 Turnout 1,224 47.4 Conservative hold Swing Conservative hold Swing Measham (2 seats) Party Candidate Votes % ±% Labour Tom Neilson 732 28.6 +8.0 Labour Sean David Sheahan 691 27.0 +5.9 Conservative Christopher Keeley 574 22.4 −1.7 Conservative Jason Summerfield 565 22.0 −1.6 Turnout 1,281 38.3 Labour gain from Conservative Swing Labour gain from Conservative Swing Moira (2 seats) Party Candidate Votes % ±% Conservative Annette Bridges 872 27.1 −0.8 Conservative John Bridges 841 26.1 −0.4 Labour John Perry 788 24.5 +1.7 Labour Jim Roberts 719 22.3 −0.5 Turnout 1,610 46.6 Conservative hold Swing Conservative hold Swing Oakthorpe and Donisthorpe (1 seat) Party Candidate Votes % ±% Labour Lesley Massey 443 47.9 +2.9 Conservative Jackie Bridgen 401 43.4 −11.6 Liberal Democrat Heather Fox 81 8.8 N/A Turnout 925 46.6 Labour gain from Conservative Swing Ravenstone and Packington (1 seat) Party Candidate Votes % ±% Conservative Nigel Smith 739 68.8 +18.8 Labour Tom Legrys 249 23.2 +5.9 Liberal Democrat Barry Wyatt 86 8.0 N/A Turnout 1,074 54.3 Conservative hold Swing Snibston (2 seats) Party Candidate Votes % ±% Labour John Geary 617 22.5 +2.3 Labour Russell Johnson 615 22.4 +2.0 Conservative Paula Diane Purver 534 19.5 −5.4 Conservative Christopher Timmis 447 16.3 −5.6 Liberal Democrat Diane Reed Barney 284 10.3 −2.3 Liberal Democrat Lee Windram 246 9.0 N/A Turnout 1,371 37.1 Labour gain from Conservative Swing Labour gain from Conservative Swing Thringstone (2 seats) Party Candidate Votes % ±% Labour Dave Everitt 882 32.2 +11.8 Labour Leon Spence 853 31.2 +8.2 Conservative Antony Dandy 576 21.0 +2.9 Conservative Jakob Whiten 397 14.5 +0.9 Liberal Democrat Nicola Timmins 156 5.7 −7.2 Liberal Democrat James Fox 126 4.6 −7.4 Turnout 1,495 48.0 Labour hold Swing Labour hold Swing Valley (2 seats) Party Candidate Votes % ±% Conservative Rowena Holland 1,041 36.9 +5.1 Conservative David Stevenson 977 34.6 +3.8 Labour John Pegg 461 16.3 +6.9 Liberal Democrat Paul Tyler 342 12.1 +0.7 Turnout 1,410 50.7 Conservative hold Swing Conservative hold Swing Whitwick (3 seats) Party Candidate Votes % ±% Labour Derek Howe 1,215 20.2 +7.2 Conservative Tony Gillard 1,042 17.3 +6.2 Labour Ray Woodward 1,011 16.8 +6.0 Conservative Russell Boam 885 14.7 +6.9 Conservative Craig Bowley 721 12.0 +5.3 BNP Ian Meller 616 10.3 −4.0 Liberal Democrat Daniel Bowler 188 3.1 −6.9 Liberal Democrat Maureen Wyatt 166 2.8 −6.1 Liberal Democrat Angela Windram 164 2.7 −6.0 Turnout 2,002 49.3 Labour gain from BNP Swing Conservative hold Swing Labour hold Swing References
- ^ North West Leicestershire District Council election, 2011 results, North West Leicestershire District Council website
See also
- United Kingdom local elections, 2011
- North West Leicestershire local elections
Preceded by
North West Leicestershire District Council election, 2007North West Leicestershire local elections Succeeded by
North West Leicestershire District Council election, 2015(2010 ←)  United Kingdom local elections, 2011 (→ 2012)
Metropolitan boroughs Barnsley · Birmingham · Bolton · Bradford · Bury · Calderdale · Coventry · Doncaster · Dudley · Gateshead · Kirklees · Knowsley · Leeds · Liverpool · Manchester · Newcastle upon Tyne · North Tyneside · Oldham · Rochdale · Rotherham · Salford · Sandwell · Sefton · Sheffield · Solihull · South Tyneside · St Helens · Stockport · Sunderland · Tameside · Trafford · Wakefield · Walsall · Wigan · Wirral · WolverhamptonUnitary authorities Bath and North East Somerset · Blackburn with Darwen · Blackpool · Bournemouth · Bracknell Forest · Brighton & Hove · Bristol · Cheshire East · Cheshire West & Chester · Darlington · Derby · East Riding of Yorkshire · Halton · Hartlepool · Herefordshire · Kingston upon Hull · Leicester · Luton · Medway · Middlesbrough · Milton Keynes · North East Lincolnshire · North Lincolnshire · North Somerset · Nottingham · Peterborough · Plymouth · Poole · Portsmouth · Reading · Redcar and Cleveland · Rutland · Slough · South Gloucestershire · Southampton · Southend-on-Sea · Stockton-on-Tees · Stoke-on-Trent · Swindon · Telford and Wrekin · Thurrock · Torbay · Warrington · West Berkshire · Windsor and Maidenhead · Wokingham · YorkDistrict councils Allerdale · Amber Valley · Arun · Ashfield · Ashford · Aylesbury Vale · Babergh · Barrow-in-Furness · Basildon · Basingstoke and Deane · Bassetlaw · Blaby · Boston · Braintree · Breckland · Brentwood · Broadland · Bromsgrove · Broxbourne · Broxtowe · Burnley · Cambridge · Cannock Chase · Canterbury · Carlisle · Castle Point · Charnwood · Chelmsford · Cherwell · Chesterfield · Chichester · Chiltern · Christchurch · Chorley · Colchester · Copeland · Corby · Cotswold · Craven · Crawley · Dacorum · Dartford · Daventry · Derbyshire Dales · Dover · Eastbourne · East Cambridgeshire · East Devon · East Dorset · East Hampshire · East Hertfordshire · Eastleigh · East Lindsey · East Northamptonshire · East Staffordshire · Eden · Elmbridge · Epping Forest · Epsom and Ewell · Erewash · Exeter · Fenland · Forest Heath · Forest of Dean · Fylde · Gedling · Gloucester · Gravesham · Guildford · Great Yarmouth · Hambleton · Harborough · Harlow · Harrogate · Hart · Havant · Hertsmere · High Peak · Hinckley and Bosworth · Horsham · Huntingdonshire · Hyndburn · Ipswich · Kettering · King's Lynn and West Norfolk · Lancaster · Lewes · Lincoln · Lichfield · Maidstone · Maldon · Malvern Hills · Mansfield · Melton · Mendip · Mid Devon · Mid Suffolk · Mid Sussex · Mole Valley · New Forest · Newark and Sherwood · Newcastle-under-Lyme · North Devon · North Dorset · North East Derbyshire · North Hertfordshire · North Kesteven · North Norfolk · North Warwickshire · North West Leicestershire · Northampton · Norwich · Oadby and Wigston · Pendle · Preston · Purbeck · Redditch · Reigate and Banstead · Ribble Valley · Richmondshire · Rochford · Rossendale · Rother · Rugby · Runnymede · Rushcliffe · Rushmoor · Ryedale · Scarborough · Sedgemoor · Selby · Sevenoaks · Shepway · South Cambridgeshire · South Derbyshire · South Hams · South Holland · South Kesteven · South Lakeland · South Norfolk · South Northamptonshire · South Oxfordshire · South Ribble · South Somerset · South Staffordshire · Spelthorne · St Albans · St Edmundsbury · Stafford · Staffordshire Moorlands · Stevenage · Stratford-on-Avon · Stroud · Suffolk Coastal · Surrey Heath · Swale · Swale · Tamworth · Tandridge · Taunton Deane · Teignbridge · Tendring · Test Valley · Tewkesbury · Thanet · Three Rivers · Tonbridge and Malling · Torridge · Tunbridge Wells · Uttlesford · Vale of White Horse · Warwick · Watford · Waveney · Waverley · Wealden · Wellingborough · Welwyn Hatfield · West Devon · West Dorset · West Lancashire · West Lindsey · West Oxfordshire · West Somerset · Weymouth and Portland · Winchester · Woking · Worcester · Worthing · Wychavon · Wycombe · Wyre · Wyre ForestMayoral elections Categories:- North West Leicestershire
- Council elections in Leicestershire
- Council elections in the East Midlands
Wikimedia Foundation. 2010.