- Demographics of St. John's
-
Demographics of the City of St. John's, Newfoundland and Labrador
Contents
Population
The information below is from the 2006 Canadian Census.
The population of the City of St. John's was estimated to be 100,646 in 2006, while the St. John's Census Metropolitan Area, which comprises 12 other communities, had a population of 181,113. In 2007, St. John’s CMA recorded the largest population increase of all CMAs in Atlantic Canada driven by intraprovincial migration. By 2008 the population was estimated at 185,288.[1]
Population trend[2]
Census Population Change (%) 2006 100,646  1.5%
1.5%2001 99,182  -2.7%
-2.7%1996 101,936 -2.6%1991 104,659 N/A Mother tongue language (2006)[3]
Language Population Pct (%) English only 95,555 96.10% Other languages 3,420 3.43% French only 355 0.35% Both English and French 95 0.09% Ethnic Groups (2006)
Race Population Pct (%) White 96,475 97.03% South Asian 875 0.88% Chinese 800 0.80% Black 520 0.52% Other 760 0.76% Religion
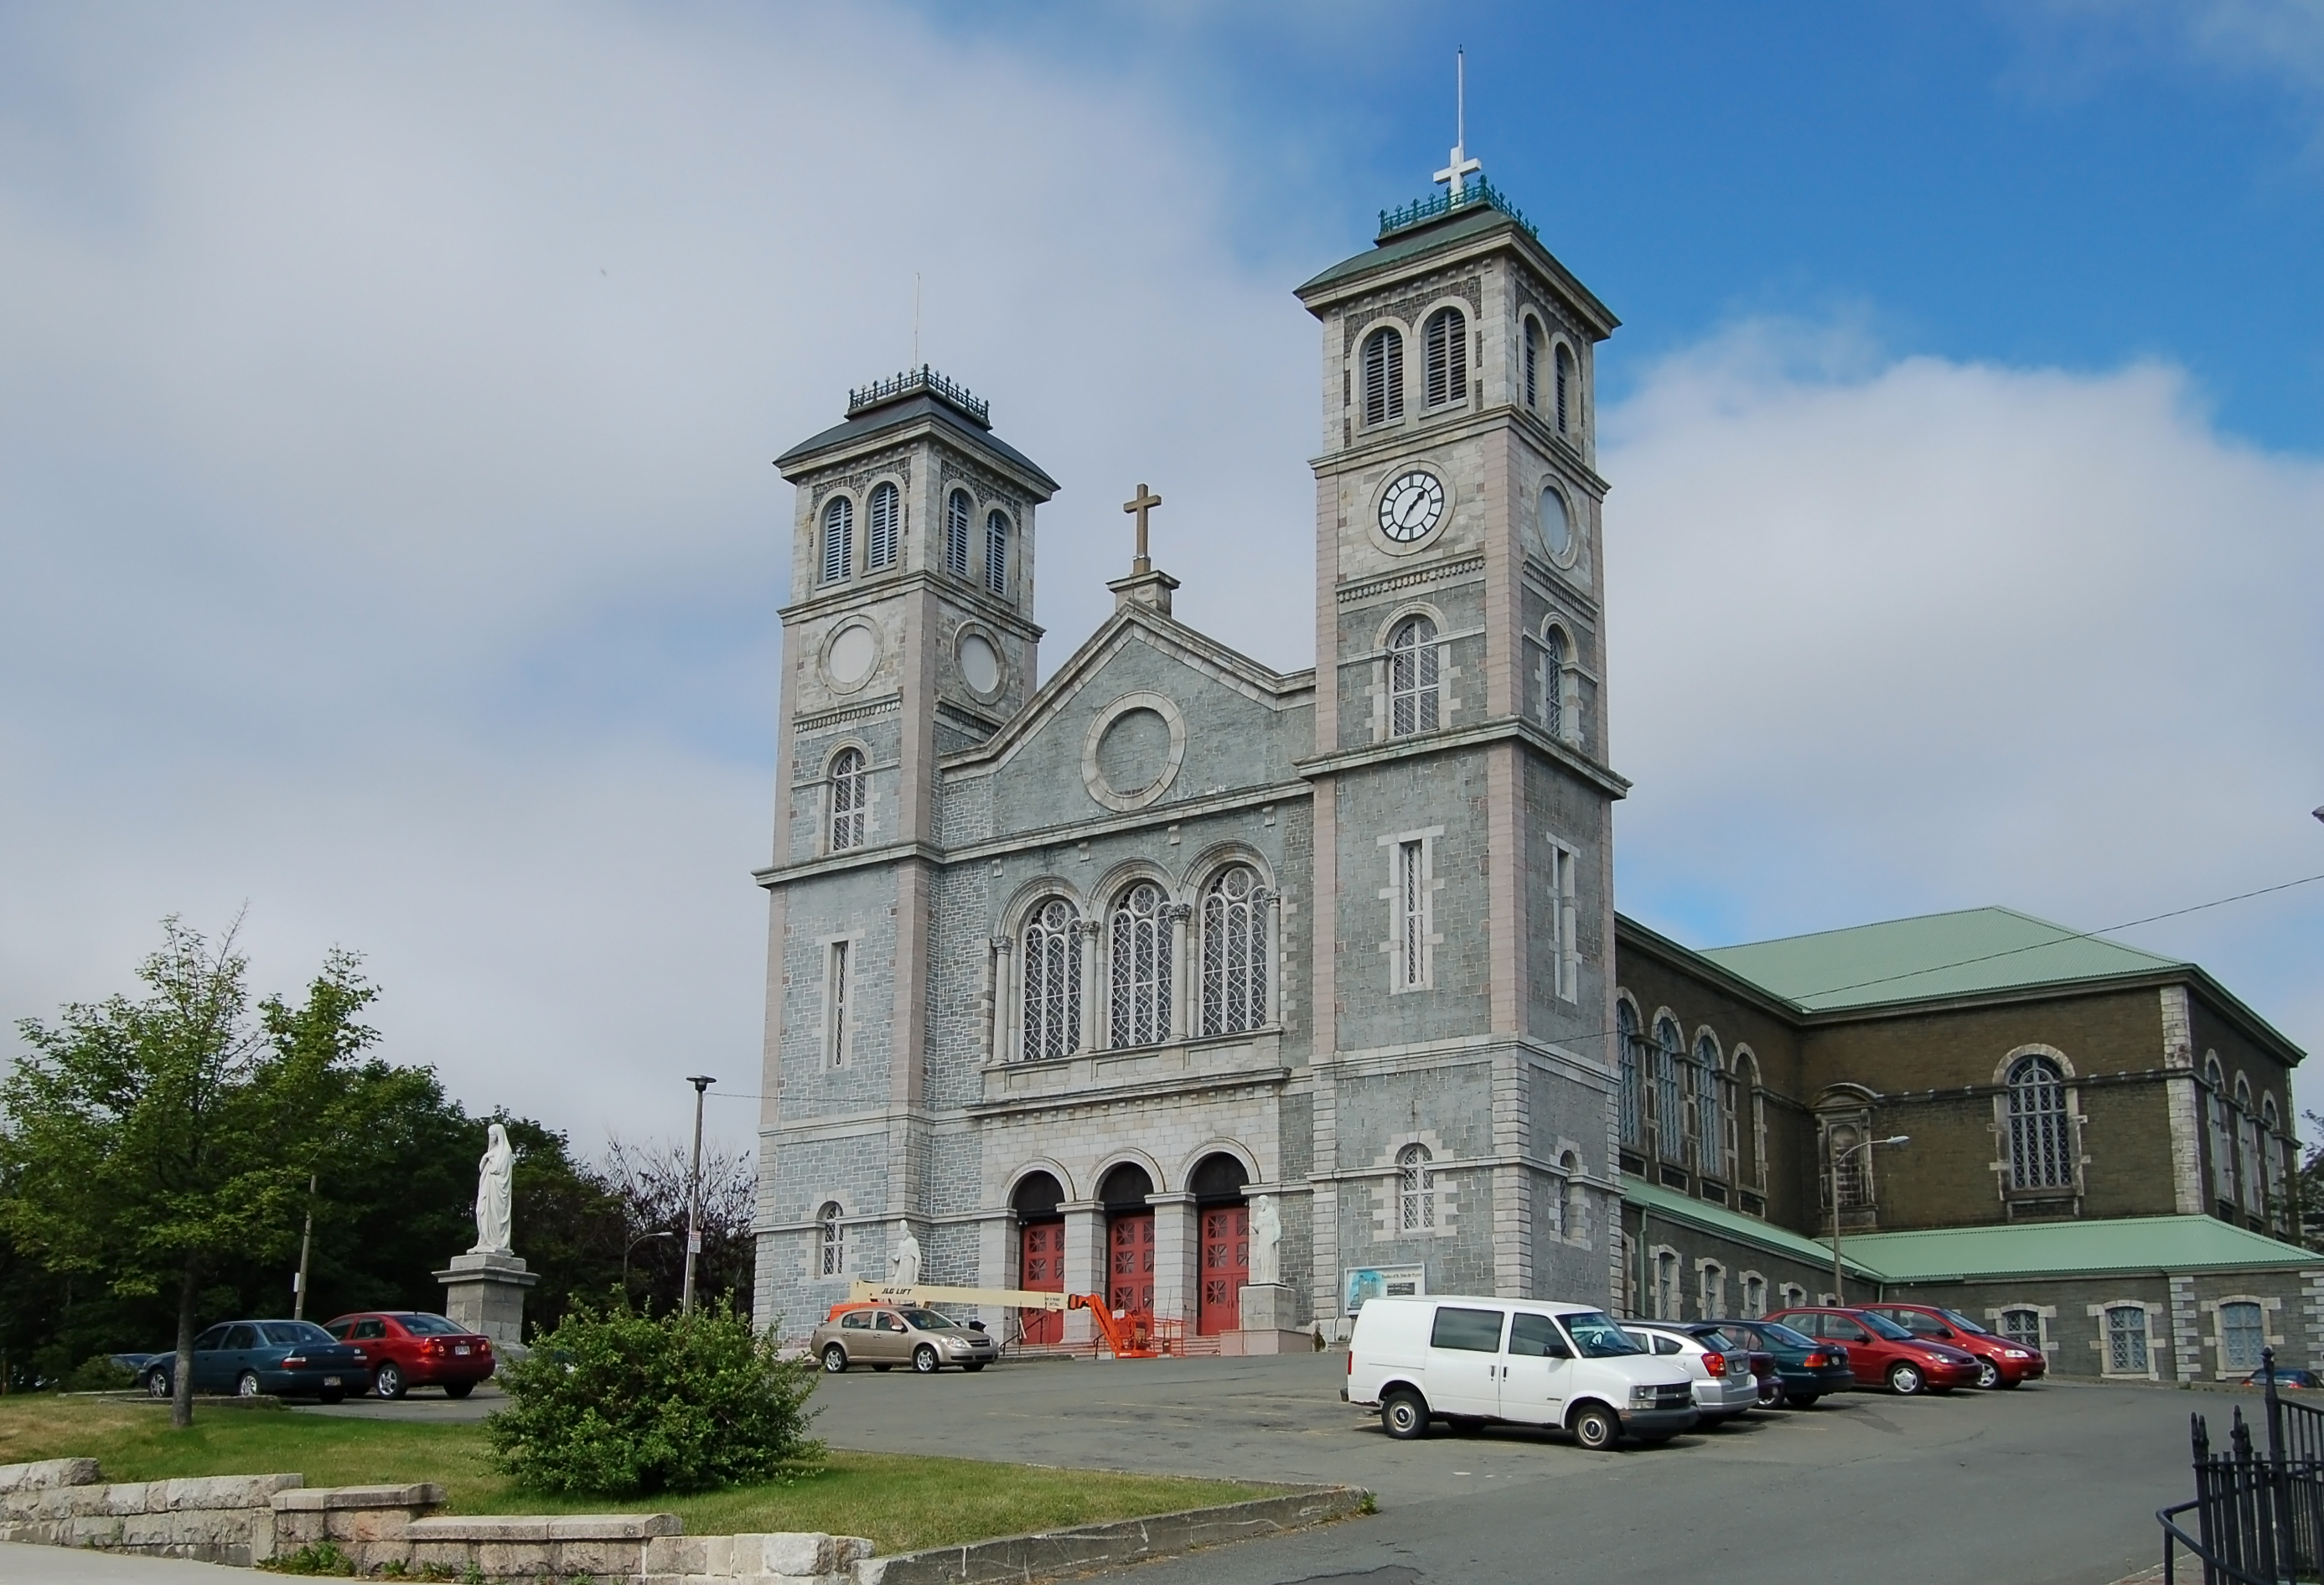
 Basilica of St. John the Baptist
The information below is from the 2001 Canadian Census.[4]
Overwhelmingly Christian, the population of St. John's was once divided along sectarian (Catholic/Protestant) lines. In recent years, this sectarianism has declined significantly, and is no longer a commonly acknowledged facet of life in St. John's. St. John's is the seat of the Roman Catholic Archbishop of St. John's, and the Anglican Bishop of Eastern Newfoundland and Labrador.
Religion 2001 % Roman Catholic 83,615 48.9% Protestant 77,880 45.5% Anglican 39,020 22.8% United Church 25,670 15.0% Salvation Army 5,645 3.3% Pentecostal 3,865 2.3% Presbyterian 1,220 0.7% Baptist 495 0.3% Jehovah's Witness 426 0.2% Other Protestant 1,540 0.9% *Christian, not included elsewhere 1,310 0.8% Muslim 475 0.3% Hindu 355 0.2% Other religions 460 0.3% No religion 6,990 3.9% Ethnic origins
 View of St. John's from The Rooms
Many of the earliest settlers of St. John's came from the English West Country (especially Devon), and southeast Ireland, primarily Waterford, Wexford and Kilkenny. These origins can still be detected in similarities between the original dialects of each of these regions and the traditional St. John's accent.
Ethnic origin 2001 Percent Canadian 81,490 47.63% English 73,545 42.98% Irish 51,180 29.92% Scottish 13,520 7.90% French 7,125 4.16% German 2,925 1.71% First Nations 1,990 1.16% Crime
St. John's has continuously had one of the lowest crime rates in Canada. Policing services are provided by the Royal Newfoundland Constabulary, which serves as the primary policing body of the metropolitan area.[5] The B Division headquarters of the Royal Canadian Mounted Police, which serves the rest of Newfoundland and Labrador, is located in the Pleasantville neighbourhood in the city's east end.[6] According to Statistics Canada's Juristat reports (1993–2007), the metropolitan area reports an average homicide rate of approximately 1.15 per 100,000 population; an average of two homicides per year. An all-time high rate of 2.27 was reported in 1993 (four homicides). This figure is far below the national average and ranks amongst the lowest rates for any metropolitan area in Canada. St. John's is ranked the 37th most dangerous city in Canada, with a crime rate of 3.87% above the national average.[7]
References
- ^ http://www.stjohns.ca/business/pdfs/EconomicOutlook2009.pdf
- ^ http://www12.statcan.ca/census-recensement/2006/dp-pd/prof/92-591/index.cfm?Lang=E
- ^ http://www12.statcan.ca/census-recensement/2006/dp-pd/prof/92-591/details/page.cfm?Lang=E&Geo1=CSD&Code1=1001519&Geo2=PR&Code2=12&Data=Count&SearchText=St.John's&SearchType=Begins&SearchPR=01&B1=All&Custom=
- ^ [1]
- ^ http://www.rnc.gov.nl.ca/default.htm
- ^ http://www.rcmp-grc.gc.ca/nl/detach/index-eng.htm
- ^ http://www2.macleans.ca/canadas-most-dangerous-cities-the-rankings/
Categories:- St. John's, Newfoundland and Labrador
- Demographics by city

Wikimedia Foundation. 2010.