- Northern Ireland (European Parliament constituency)
-
Northern Ireland
European Parliament constituency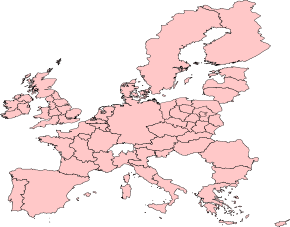

Location amongst the 2007 constituencies Created 1979 MEP(s) 3 (2004) Member State United Kingdom Source(s) [1][2] Northern Ireland is a constituency of the European Parliament. It currently elects three MEPs using the Single Transferable Vote, the only United Kingdom constituency to do so.
Contents
Boundaries
The constituency covers the entirety of Northern Ireland.
Members of the European Parliament
Northern Ireland 
This article is part of the series:
Politics and government of
Northern IrelandNorthern Irish Law
Year Member Party Member Party Member Party 1979 Ian Paisley Democratic Unionist John Hume SDLP John Taylor Ulster Unionist 1984 1989 Jim Nicholson 1994 1999 2004 Jim Allister Bairbre de Brún Sinn Féin 2007 Traditional Unionist Voice 2009 Diane Dodds Democratic Unionist Conservatives and Unionists 2009
The election was held on Thursday 4 June 2009.[1]
European Parliament election, 2009: Northern Ireland Party Candidate Seats Loss/Gain
(to 2004)First Preference Votes Number % of vote Sinn Féin Bairbre de Brún 1 0 126,184 26.0 Democratic Unionist Diane Dodds 1 0 88,346 18.2 Conservatives and Unionists Jim Nicholson 1 0 82,893 17.1 SDLP Alban Maginness 0 0 78,489 16.2 Traditional Unionist Voice Jim Allister 0 0 66,197 13.6 Alliance Ian Parsley 0 0 26,699 5.5 Green (NI) Steven Agnew 0 0 15,764 3.2 Turnout 438,469 42.8 - Note: The numbers in the turnout"number" column add up to 484,572 not 438,469 both figures are also at odds with the http://en.wikipedia.org/wiki/European_Parliament_election,_2009_(United_Kingdom) figure of 488,891 which cites a BBC News article which givesa turnout figure of 484,572 .
- Note: Jim Allister was elected in 2004 for the DUP, but defected to the TUV during the last parliament.
Source: Electoral Office for Northern Ireland
2004
European Parliament election, 2004 (United Kingdom): Northern Ireland [2] Party Candidate(s) Seats Loss/Gain First Preference Votes Number % of vote Democratic Unionist Jim Allister 1 0 175,761 31.9 Sinn Féin Bairbre de Brún 1 +1 144,541 26.3 Ulster Unionist Jim Nicholson 1 0 91,164 16.6 SDLP Martin Morgan 0 -1 87,559 15.9 Independent John Gilliland 0 0 36,270 6.6 Socialist Environmental Eamon McCann 0 0 9,172 1.6 Green (NI) Lindsay Whitcroft 0 0 4,810 0.9 Turnout 549,277 51.7 1999
European Parliament election, 1999 (United Kingdom): Northern Ireland [3] Party Candidate(s) Seats Loss/Gain First Preference Votes Number % of vote Democratic Unionist Ian Paisley 1 0 192,762 28.4 SDLP John Hume 1 0 190,731 28.1 Ulster Unionist Jim Nicholson 1 0 119,507 17.6 Sinn Féin Mitchel McLaughlin 0 0 117,643 17.3 Progressive Unionist David Ervine 0 0 22,494 3.31 UK Unionist Robert McCartney 0 0 20,283 2.98 Alliance Sean Neeson 0 0 14,391 2.12 Natural Law James Anderson 0 0 998 0.15 Turnout 678,809 1994
European Parliament election, 1994: Northern Ireland [4] Party Candidate(s) Seats Loss/Gain First Preference Votes Number % of vote Democratic Unionist Ian Paisley 1 0 163,246 29.2 SDLP John Hume 1 0 161,992 28.9 Ulster Unionist Jim Nicholson 1 0 133,459 23.8 Sinn Féin Tom Hartley
Dodie McGuinness
Francie Molloy0 0 55,215 9.9 Alliance Mary Clark-Glass 0 0 23,157 4.1 Ulster Independence Hugh Ross 0 0 7,858 1.4 Conservative Myrtle Boal 0 0 5,583 1.0 Workers' Party John Lowry 0 0 2,543 0.5 Labour Party NI Niall Cusack 0 0 2,464 0.4 Natural Law James Anderson
Susannah Thompson
Michael Kennedy0 0 2,291 0.4 Peace Coalition June Campion 0 0 1,088 0.2 Independent Ulster David Kerr 0 0 579 0.1 Constitutional Independent NI Robert Mooney 0 0 400 0.1 Turnout 559,867 1989
European Parliament election, 1989: Northern Ireland [5] Party Candidate(s) Seats Loss/Gain First Preference Votes Number % of vote Democratic Unionist Ian Paisley 1 0 160,110 30 SDLP John Hume 1 0 136,335 25 Ulster Unionist Jim Nicholson 1 0 118,785 22 Sinn Féin Danny Morrison 0 0 48,914 9 Alliance John Alderdice 0 0 27,905 5 Conservative Myrtle Boal 0 0 25,789 5 Green Malcolm Samuel 0 0 6,569 1 Workers' Party Seamus Lynch 0 0 5,590 1 Labour Representation Mark Langhammer 0 0 3,540 0 Labour '87 Brian Caul 0 0 1,274 0 Turnout 534,811 1984
European Parliament election, 1984: Northern Ireland [6] Party Candidate(s) Seats Loss/Gain First Preference Votes Number % of vote Democratic Unionist Ian Paisley 1 0 230,251 33.6 SDLP John Hume 1 0 151,399 22.1 Ulster Unionist John Taylor 1 0 147,169 21.5 Sinn Féin Danny Morrison 0 0 91,476 13.3 Alliance David Cook 0 0 34,046 5.0 Ulster Popular Unionist James Kilfedder 0 0 20,092 2.9 Workers' Party Seamus Lynch 0 0 8,712 1.3 Ecology Colin McGuigan 0 0 2,172 0.3 Turnout 685,317 1979
European Parliament election 1979: Northern Ireland [7] Party Candidate(s) Seats Loss/Gain First Preference Votes Number % of vote Democratic Unionist Ian Paisley 1 N/A 170,688 29.8 SDLP John Hume 1 N/A 140,622 25.5 Ulster Unionist John Taylor
Harry West1 N/A 125,169 21.9 Alliance Oliver Napier 0 N/A 39,026 6.8 Independent Unionist James Kilfedder 0 N/A 38,198 6.7 Independent Bernadette McAliskey 0 N/A 33,969 5.9 United Community David Bleakley 0 N/A 9,383 1.6 United Labour Paddy Devlin 0 N/A 6,122 1.1 Workers' Party Brian Brennan
Francie Donnelly0 N/A 4,418 0.8 Unionist Party NI Eddie Cummings 0 N/A 3,712 0.6 Liberal James Murray 0 N/A 932 0.2 Turnout 572,239 References
- ^ "Q&A: The 2009 elections". BBC News Online. 2009-06-03. http://news.bbc.co.uk/2/hi/uk_news/politics/8070470.stm. Retrieved 2009-06-04.
- ^ The 2004 European Election, Northern Ireland Elections
- ^ The 1999 European Election, Northern Ireland Elections
- ^ The 1994 European Election, Northern Ireland Elections
- ^ The 1989 European Election, Northern Ireland Elections
- ^ The 1984 European Election, Northern Ireland Elections
- ^ The 1979 European Election, Northern Ireland Elections
Constituencies in Northern Ireland (18) DUP (8) Sinn Féin (5) SDLP (3) Alliance (1) Independent (1) Northern Ireland European constituency Sinn Féin (1 seat) · DUP (1 seat) · UUP (1 seat) 2004–2009 ← European Parliament constituencies 2009–2014 → 2014–2019 Belgium France East · Île-de-France · Massif-Centre · North-West · Overseas Territories · South-East · South-West · West
Ireland Dublin · East · North-West · South
Italy Central · Islands · North-East · North-West · Southern
Poland United Kingdom East Midlands · East of England · London · North East England · Northern Ireland · North West England · Scotland · South East England · South West England (including Gibraltar) · Wales · West Midlands · Yorkshire and the Humber
National Categories:- European Parliament constituencies in the United Kingdom
- European Parliament constituencies in Northern Ireland


Wikimedia Foundation. 2010.