- Croatian parliamentary election, 1995
-
Croatian parliamentary election, 1995 
1992 ←
members29 October 1995 → 2000
membersAll 127 seats to Hrvatski sabor First party Second party 
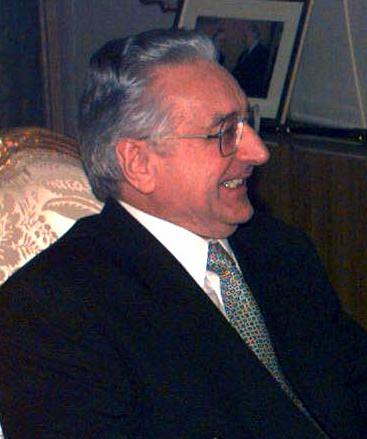
Leader Franjo Tuđman Zlatko Tomčić Party HDZ HSS Last election 85 seats, 61.6% 13 seats, 9.4%
(HSS, IDS, HNS)Seats won 75 18
(HSS-led coalition)Seat change  10
10 5
5Popular vote 1,093,403 441,390 Percentage 45.2% 18.3% Third party Fourth party 
Leader Dražen Budiša Ivica Račan Party HSLS SDP Last election 14 seats, 10.1% 11 seats, 8.0% Seats won 12 10 Seat change 21Popular vote 279,245 215,839 Percentage 11.6% 8.9%
Prime Minister before election
Subsequent Prime Minister
Croatia 
This article is part of the series:
Politics and government of
CroatiaConstitutionJudiciaryExecutive- President (List)
- Ivo Josipović
- Government (List)
- Prime Minister
- Jadranka Kosor
- Cabinet
- Prime Minister
- Croatian Democratic Union (HDZ)
- Social Democratic Party (SDP)
- Croatian People's Party -
Liberal Democrats (HNS-LD) - Croatian Peasant Party (HSS)
- Istrian Democratic Assembly (IDS)
- Croatian Democratic Alliance
of Slavonia and Baranja (HDSSB) - Croatian Social Liberal Party (HSLS)
- Croatian Party of Pensioners (HSU)
- Croatian Party of Rights (HSP)
Divisions
Parliamentary elections were held in Croatia on 29 October 1995.[1] The result was a victory for the Croatian Democratic Union, which won 75 of the 127 seats. Voter turnout was 68.8%.[2]
Contents
Background
The term of the existing Chamber of Representatives was to expire one year later, in 1996. However, Croatian government of Franjo Tudjman and his Croatian Democratic Union party hoped to exploit national euphoria over the success of Operation Storm. Chamber of Representatives was quickly dissolved, but not before passing yet another piece of electoral legislation, introducing new voting system which was to improve chances of ruling party.[citation needed]
According to the new electoral law, 28 seats were won in individual constituencies on First past the post basis, while 80 seats were to be distributed on the basis of proportional representation, with the threshold being raised from previous 2% to 5%.
Another addition was raised threshold for lists of party coalitions - 8% for coalition of two parties and 11% for coalition of three and more parties. It is more than obvious that the new rules were introduced to discourage coalitions of small opposition parties and subsequently have their votes dispersed and wasted below the threshold, allowing stronger party to get additional seats.
While 12 seats were kept for Croatian expatriates, number of seats reserved for ethnic minorities have changed. This was most evident in case of Serbs, who had only 3 seats compared with previous 11.
Under such conditions, Croatian opposition parties were more concerned about their own political survival than actually challenging ruling party. Learning from their mistakes during 1992 elections, they created ad hoc coalitions and circumvented electoral thresholds by fielding other parties' members as their won candidates on the lists.
In the end, HDZ won roughly the same percentage of votes and same number of seats as three years earlier. More significant changes were among the ranks of Croatian opposition. Social Democratic Party of Croatia re-emerged as significant political factor with 8.93 % votes, at the expense of Croatian Social Liberal Party which had its share of votes nearly halved. Both parties, however, were not as successful as large opposition coalition which included Croatian Peasant Party, Croatian People's Party and Istrian Democratic Assembly.
The most tense moment of the campaign occurred during the vote count. It appeared that Croatian Party of Rights would fail to break 5% threshold, only for the vote to mysteriously increase afterwards.
The election was held in conjunction with special elections for Zagreb City Assembly, which resulted with Zagreb Crisis.
Results
Party PR Constituency Diaspora Total
seats+/– Votes % Seats Votes % Seats Votes % Seats Croatian Democratic Union 1,093,403 45.23 42 21 12 75 –10 HSS-IDS-HNS-HKDU-SBHS[a] 441,390 18.26 16 2 0 18 +5 Croatian Social Liberal Party 279,245 11.55 10 2 0 12 –2 Social Democratic Party 215,839 8.93 8 2 0 10 –1 Croatian Party of Rights 121,095 5.01 4 0 0 4 –1 Social Democratic Union 78,282 3.24 0 0 0 0 0 Croatian Independent Democrats 72,612 3.00 0 0 1 +1 Social Democratic Action of Croatia 40,348 1.57 0 0 1 +1 Croatian Party of Rights 1861 31,530 1.30 0 0 0 0 0 Croatian Christian Democratic Party 16,986 0.70 0 0 0 0 0 Alliance of Primorje-Gorski Kotar 0 0 1 0 Serb People's Party 0 0 2 –1 Other parties 26,644 1.10 0 0 0 0 0 Independents – – 0 4 0 4 –1 Invalid/blank votes 82,666 – – – – – – – – Total 2,500,040 100 80 28 12 127 –11 Sources: - Nohlen & Stöver,
- IDS-DDI web site,
- HIDRA 1995 election statistics,
- Ilišin, Vlasta (September 1999). "Strukturna dinamika hrvatskog parlamenta [Structural dynamics of the Croatian Parliament]" (in Croatian). Politička misao: Croatian Political Science Review (Faculty of Political Science, University of Zagreb) 36 (3): pp. 151–174. ISSN 0032-3241. http://hrcak.srce.hr/index.php?show=clanak&id_clanak_jezik=50836. Retrieved 2011-11-13.
- "Broj i postotak stranačkih zastupnika u Hrvatskome saboru od 1992. do 2001. godine" (in Croatian). Parlamentarne stranke. Croatian Information-Documentation Referral Agency. http://www.hidra.hr/cro/politicke_stranke/parlamentarne_stranke/zastupljenost_stranaka_u_saboru. Retrieved 2011-11-13.
a Within the alliance, the Croatian Peasant Party won 10 seats (+7), the Istrian Democratic Assembly won 3 (no change), the Croatian People's Party won 2 (–4), the Croatian Christian Democratic Union won 1 (+1) and the Slavonia-Baranja Croatian Party won one (+1).
Subsequent changes
The following changes happened after elections:
- The Croatian Pure Party of Rights gained one member of parliament
- The Croatian Christian Democratic Union gained one more member of parliament
- The Serb People's Party lost one member of parliament
- The Independent Democratic Serb Party gained one member of parliament
- The Liberal Party gained four members of parliament
- The Istrian Democratic Forum gained one member of parliament
- The Croatian Independent Democrats lost one member of parliament
- Social Democratic Action of Croatia lost one member of parliament
References
Elections and referendums in Croatia Kingdom of Croatia-Slavonia Kingdom of Dalmatia Parliamentary elections Presidential elections Chamber of Counties elections Local elections Referendums (For the 1918–1989 period see Elections in Yugoslavia)Categories:- Elections in Croatia
- 1995 elections in Europe
- 1995 in Croatia
- President (List)

Wikimedia Foundation. 2010.