- Bayview-Montalvin, California
Infobox Settlement
official_name = Bayview-Montalvin, California
other_name =
native_name =
nickname =
settlement_type = CDP
motto =
imagesize =
image_caption =
flag_size =
image_
seal_size =
image_shield =
shield_size =
image_blank_emblem =
blank_emblem_type =
blank_emblem_size =
imagesize =
image_caption =
flag_size =
image_
seal_size =
image_shield =
shield_size =
image_blank_emblem =
blank_emblem_type =
blank_emblem_size =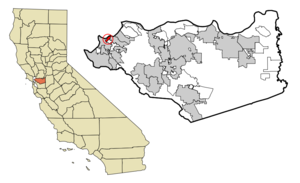
mapsize = 250x200px
map_caption = Location in Contra Costa County and the state ofCalifornia
mapsize1 =
map_caption1 =
image_dot_
dot_mapsize =
dot_map_caption =
dot_x =
dot_y =
pushpin_
pushpin_label_position =
pushpin_map_caption =
pushpin_mapsize =
subdivision_type = Country
subdivision_name =United States
subdivision_type1 = State
subdivision_name1 =California
subdivision_type2 = County
subdivision_name2 = Contra Costa
subdivision_type3 =
subdivision_name3 =
subdivision_type4 =
subdivision_name4 =
government_footnotes =
government_type =
leader_title = N/A
leader_name =
leader_title1 =
leader_title1 = Senate
leader_name1 =Tom Torlakson (D)
leader_title2 = Assembly
leader_name2 =Mark DeSaulnier (D)
leader_title3 = U. S. Congress
leader_name3 = George Miller (D)
leader_title4 =
leader_name4 =
established_title =
established_date =
established_title2 =
established_date2 =
established_title3 =
established_date3 =
area_magnitude =
unit_pref =
area_footnotes =
area_total_km2 = 2.2
area_land_km2 = 1.7
area_water_km2 = 0.5
area_total_sq_mi = 0.8
area_land_sq_mi = 0.6
area_water_sq_mi = 0.2
area_water_percent =
area_urban_km2 =
area_urban_sq_mi =
area_metro_km2 =
area_metro_sq_mi =
area_blank1_title =
area_blank1_km2 =
area_blank1_sq_mi =
population_as_of = 2000
population_footnotes =
population_note =
population_total = 5004
population_density_km2 = 2274.5
population_density_sq_mi = 6255
population_metro =
population_density_metro_km2 =
population_density_metro_sq_mi =
population_urban =
population_density_urban_km2 =
population_density_urban_sq_mi =
population_blank1_title =
population_blank1 =
population_density_blank1_km2 =
population_density_blank1_sq_mi =
timezone = PST
utc_offset = -8
timezone_DST = PDT
utc_offset_DST = -7
latd = 38 |latm = 0 |lats = 3 |latNS = N
longd = 122 |longm = 19 |longs = 31 |longEW = W
elevation_footnotes =
elevation_m =
elevation_ft =
postal_code_type =ZIP code
postal_code = 94806
area_code = 510
blank_name = FIPS code
blank_info = 06-04503
blank1_name =
blank1_info =
website =
footnotes =Bayview-Montalvin is a
census-designated place (CDP) in Contra Costa County,California ,United States . The population was 5,004 at the 2000 census.Geography
Bayview-Montalvin is located at coor dms|38|0|3|N|122|19|31|W|city (38.000805, -122.325242)GR|1.
According to the
United States Census Bureau , the CDP has a total area of 0.8square mile s (2.1km² ), of which, 0.6 square miles (1.7 km²) of it is land and 0.2 square miles (0.5 km²) of it (23.17%) is water.Demographics
As of the
census GR|2 of 2000, there were 5,004 people, 1,461 households, and 1,164 families residing in the CDP. Thepopulation density was 7,845.0 people per square mile (3,018.8/km²). There were 1,476 housing units at an average density of 2,314.0/sq mi (890.4/km²). The racial makeup of the CDP was 47.72% White, 11.97% Black or African American, 1.10% Native American, 13.89% Asian, 0.76% Pacific Islander, 19.24% from other races, and 5.32% from two or more races. 35.19% of the population were Hispanic or Latino of any race.There were 1,461 households out of which 38.1% had children under the age of 18 living with them, 58.7% were married couples living together, 14.5% had a female householder with no husband present, and 20.3% were non-families. 16.6% of all households were made up of individuals and 8.7% had someone living alone who was 65 years of age or older. The average household size was 3.42 and the average family size was 3.78.
In the CDP the population was spread out with 28.9% under the age of 18, 9.1% from 18 to 24, 28.4% from 25 to 44, 22.2% from 45 to 64, and 11.3% who were 65 years of age or older. The median age was 34 years. For every 100 females there were 96.2 males. For every 100 females age 18 and over, there were 93.4 males.
The median income for a household in the CDP was $50,750, and the median income for a family was $53,315. Males had a median income of $43,750 versus $30,318 for females. The
per capita income for the CDP was $16,056. About 7.8% of families and 11.7% of the population were below thepoverty line , including 11.1% of those under age 18 and 7.9% of those age 65 or over.External links
Wikimedia Foundation. 2010.