- Enthalpy–entropy chart
-
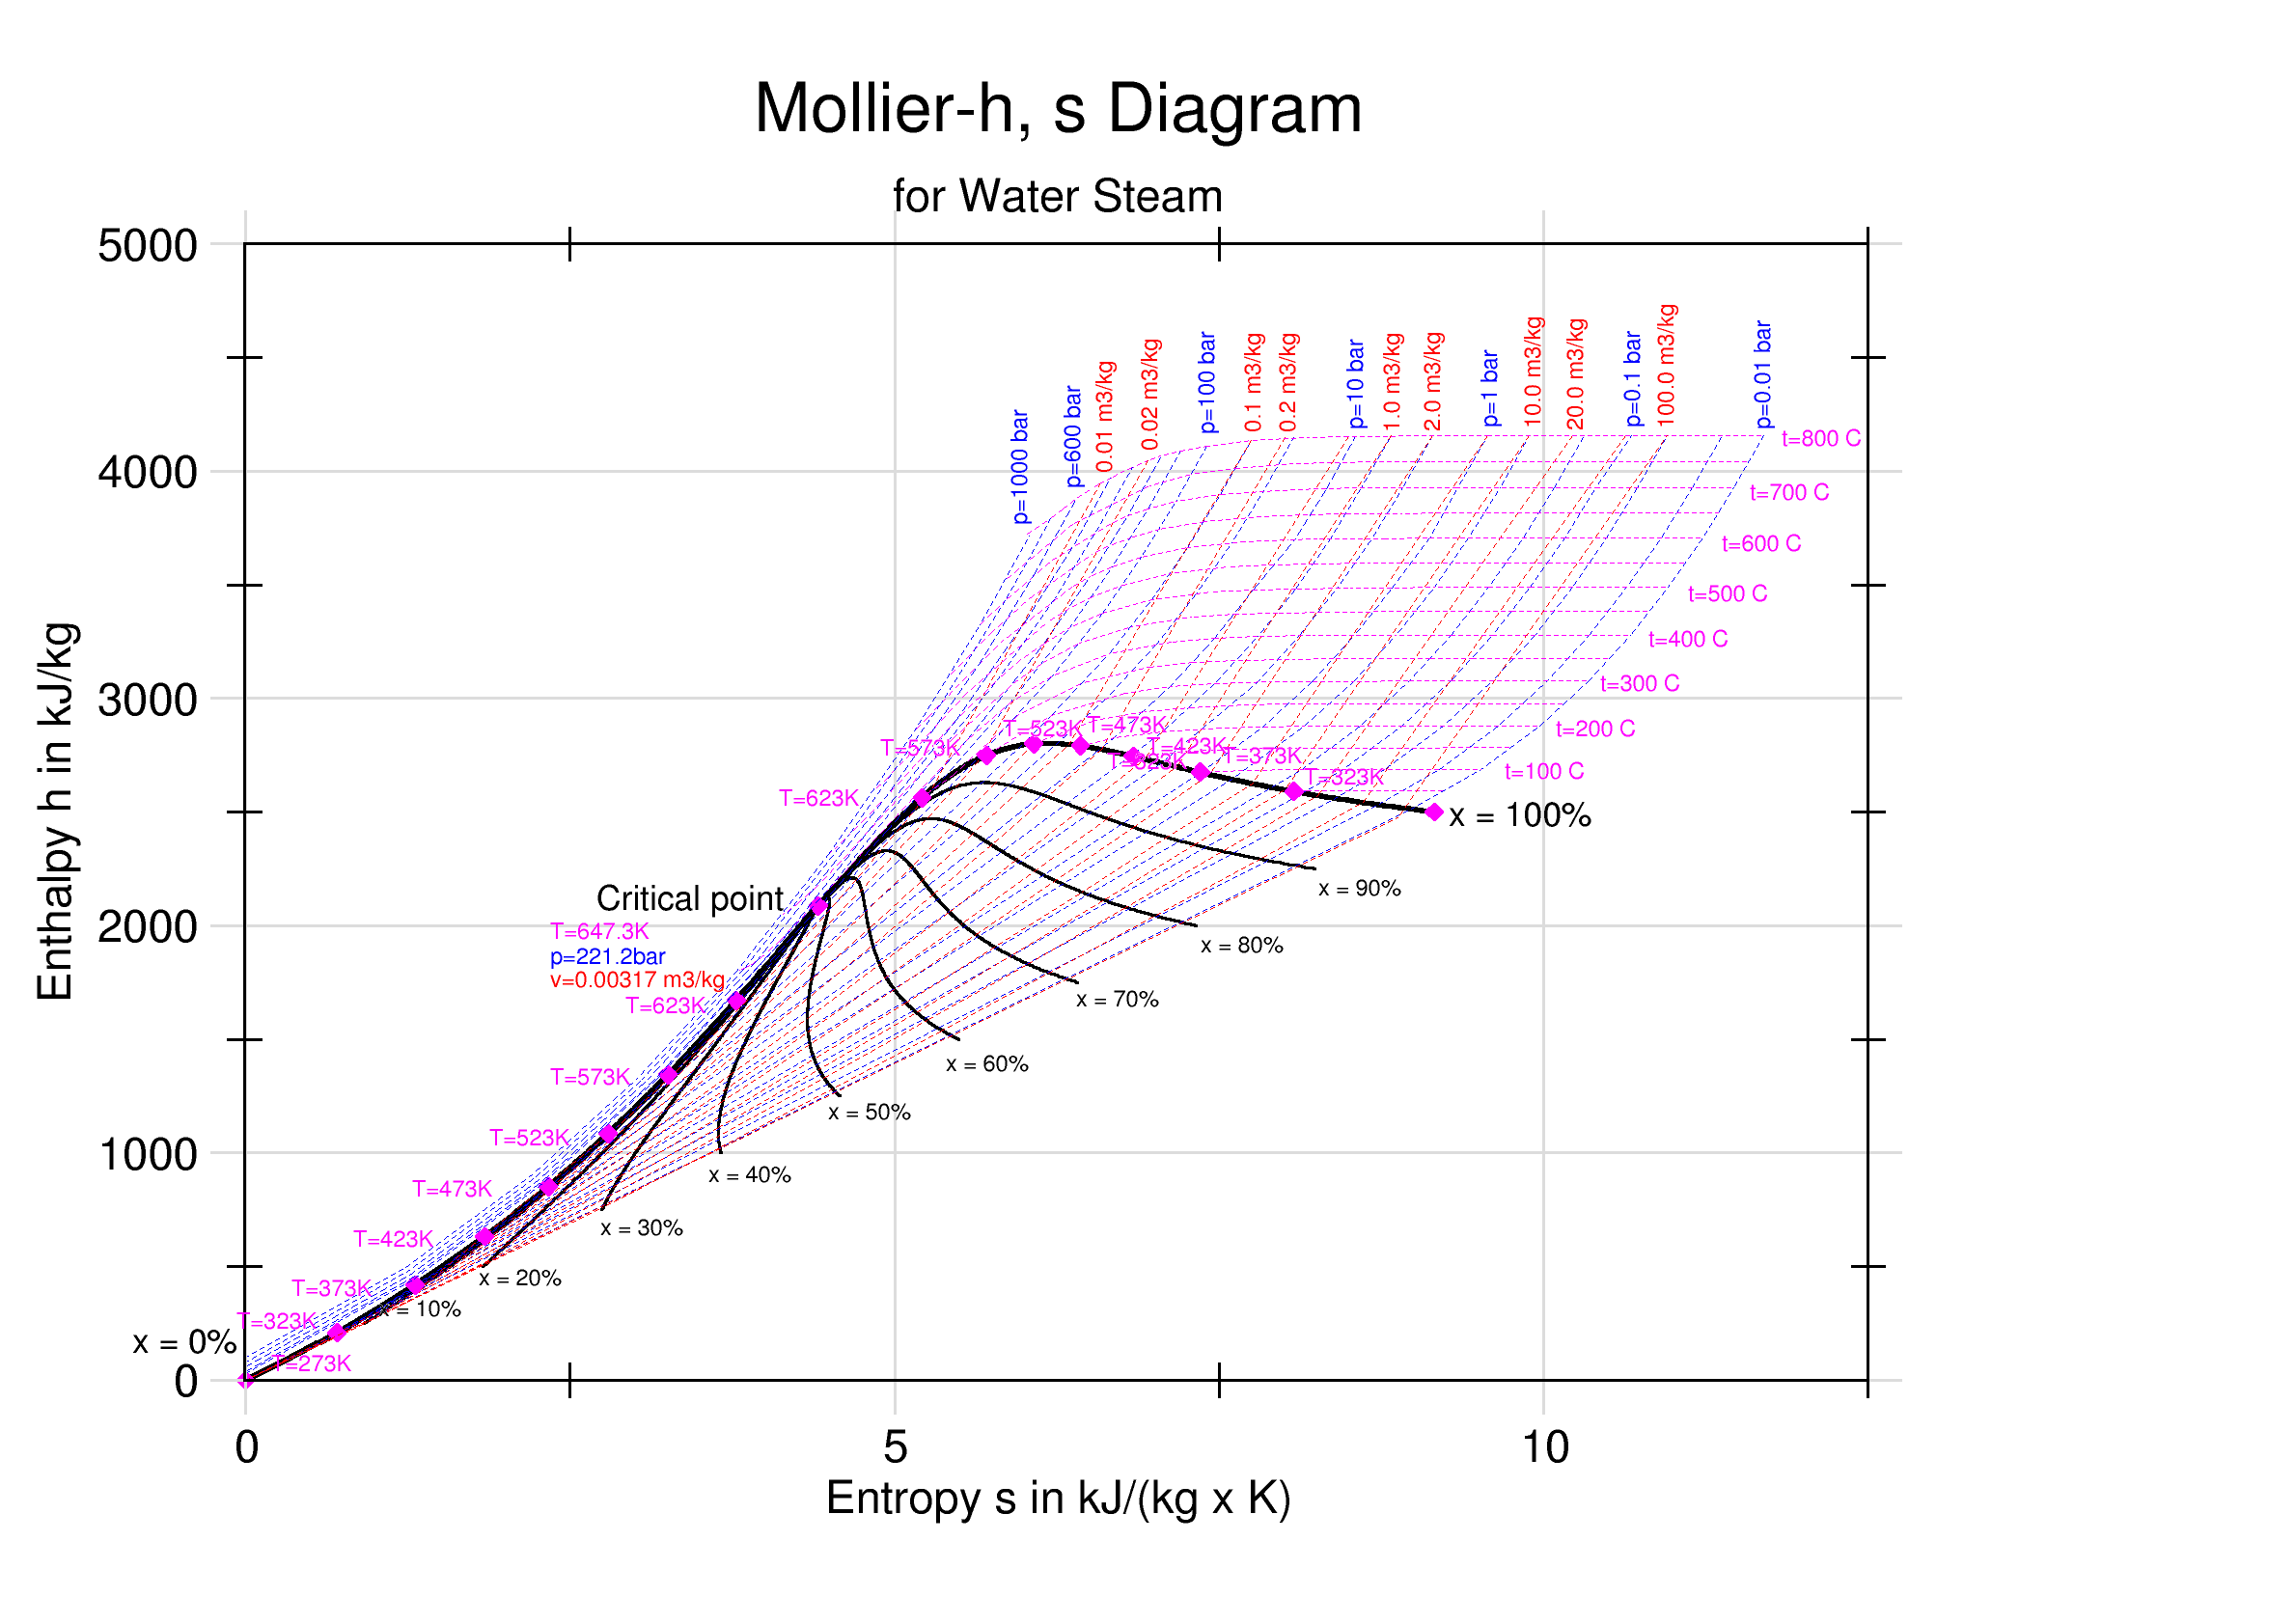
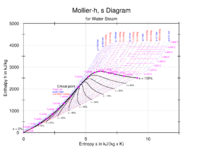 The Mollier Enthalpy-Entropy Diagram for water and steam. The "dryness fraction", x, gives the fraction by mass of gaseous water in the wet region, the remainder being droplets of liquid.
An enthalpy–entropy chart, also known as the h–s chart or Mollier diagram plots the total heat against entropy,[1] describing the enthalpy of a thermodynamic system.[2] A typical chart covers a pressure range of 0.01 - 1000 bar, and temperatures up to 800 degrees Celsius.[3] It shows enthalpy h in terms of internal energy u, pressure P and volume v using the relationship
 .
.Contents
History
The diagram was created in 1904, when Richard Mollier plotted the total heat against entropy.[1] At the 1923 Thermodynamics Conference held in Los Angeles it was decided to name, in his honor, as a “Mollier diagram” any thermodynamic diagram using the Enthalpy h as one of its axes.[4]
Details
 Mollier Diagram (Chart), IP Units
 Mollier Diagram (Chart), IP Units
On the diagram, lines of constant pressure, constant temperature and volume are plotted, so in a two-phase region, the lines of constant pressure and temperature coincide.[5] Thus, coordinates on the diagram represent entropy and heat.[6]
The work done on vapor cycles is represented by length, so it can be measured directly, whereas in a T–s diagram it is shown as an area.[1]
In an isobaric process, the pressure remains constant, so the heat interaction is the change in enthalpy.[2]
In an isenthalpic process, the enthalpy is constant.[2] A vertical line in the h–s chart means an isentropic process and an horizontal line means an isenthalpic process. The process 3-4 in a rankine cycle is isentropic when the steam turbine is said to be an ideal one. So the expansion process in a turbine can be easily calculated using the h–s chart when the process is considered to be ideal (which is the case normally when calculating enthalpies, entropies, etc. Later the deviations from the ideal values can be calculated considering the isentropic efficiency of the steam turbine used.)
In a throttling process, the Joule–Thomson effect means that an adiabatic device uses energy equal to the decrease in the enthalpy of the fluid flowing through the device.[2]
Lines of constant dryness fraction (x), sometimes called the quality of the steam, are drawn in the wet region and lines of constant temperature are drawn in the superheated region.[3] X gives the fraction (by mass) of gaseous water in the wet region, the remainder being colloidal liquid droplets. Above the heavy line, the temperature is above the boiling point, and the dry (superheated) steam consists of gas only.
In general such charts do not show the values of specific volumes, nor do they show the enthalpies of saturated water at pressures which are of the order of those experienced in condensers in a thermal power station.[3] Hence the chart is only useful for enthalpy changes in the expansion process of the steam cycle.[3]
Applications and Usage
It can be used in practical applications such as malting, to represent the grain-air-moisture system.[7]
The underlying property data for the Mollier diagram is identical to a psychrometric chart. At first inspection, there may appear little resemblance between the charts, but if the user rotates a chart ninety degrees and looks at it in a mirror, the resemblance is apparent. The Mollier diagram coordinates are enthalpy h and humidity ratio x. The enthalpy coordinate is skewed and the constant enthalpy lines are parallel and evenly spaced.
The Mollier diagram is preferred by many users in Scandinavia, Eastern Europe, and Russia.[8]
See also
References
- ^ a b c R. K. Rajput (2009), Engineering Thermodynamics, Infinity Science Series / Engineering series (3 ed.), Jones & Bartlett Learning, p. 77, ISBN 9781934015148, http://books.google.co.uk/books?id=YnXSHFmPdzMC&pg=PA77&dq=mollier+diagram&hl=en&ei=IIMkTLC5G4Sd_Abwy9XoBA&sa=X&oi=book_result&ct=result&resnum=5&ved=0CEMQ6AEwBA#v=onepage&q=mollier%20diagram&f=false, retrieved 2010-06-25
- ^ a b c d Y. V. C. Rao (2004), An Introduction to Thermodynamics, Universities Press, p. 70, ISBN 9788173714610, http://books.google.co.uk/books?id=bKoUHSxujZIC&pg=PA70&dq=mollier+diagram&hl=en&ei=IIMkTLC5G4Sd_Abwy9XoBA&sa=X&oi=book_result&ct=result&resnum=3&ved=0CDkQ6AEwAg#v=onepage&q=mollier%20diagram&f=false, retrieved 2010-06-25
- ^ a b c d T.D. Eastop, A. Mcconkey (15 Mar 1993) (Paperback), Applied Thermodynamics for Engineering Technologists (5 ed.), Longman, ISBN 978-0582091931
- ^ Mollier, R. 1923. “Ein neues diagram für dampfluftgemische.” ZVDI 67(9)
- ^ Y. V. C. Rao (2001), Thermodynamics, Universities Press, p. 113, ISBN 9788173713880, http://books.google.co.uk/books?id=Fv6EpL10gY8C&pg=PA113&dq=mollier+diagram&hl=en&ei=bo8kTIKXO4GC_AbSpcXkBA&sa=X&oi=book_result&ct=result&resnum=10&ved=0CFoQ6AEwCTgK#v=onepage&q=mollier%20diagram&f=false, retrieved 2010-06-25
- ^ Robert C. H. Heck (2008), The Steam Engine and Turbine - A Text Book for Engineering Colleges, Read Books, ISBN 9781443731348, http://books.google.co.uk/books?id=A5RnxZx51eoC&pg=PA138&dq=mollier+diagram&hl=en&ei=IIMkTLC5G4Sd_Abwy9XoBA&sa=X&oi=book_result&ct=result&resnum=10&ved=0CFwQ6AEwCQ#v=onepage&q=mollier%20diagram&f=false, retrieved 2010-06-25
- ^ Dennis Edward Briggs (1998), Malts and Malting, Springer, p. 499, ISBN 9780412298004, http://books.google.co.uk/books?id=s9tf70Wk3bYC&pg=PA499&dq=mollier+diagram&hl=en&ei=bo8kTIKXO4GC_AbSpcXkBA&sa=X&oi=book_result&ct=result&resnum=8&ved=0CFAQ6AEwBzgK#v=onepage&q=mollier%20diagram&f=false, retrieved 2010-06-25
- ^ Todorovic, B., ASHRAE Transactions DA-07-024 (113-1), 2007
Categories:

Wikimedia Foundation. 2010.