Richard Mollier

Richard Mollier
Not to be confused with Molière.
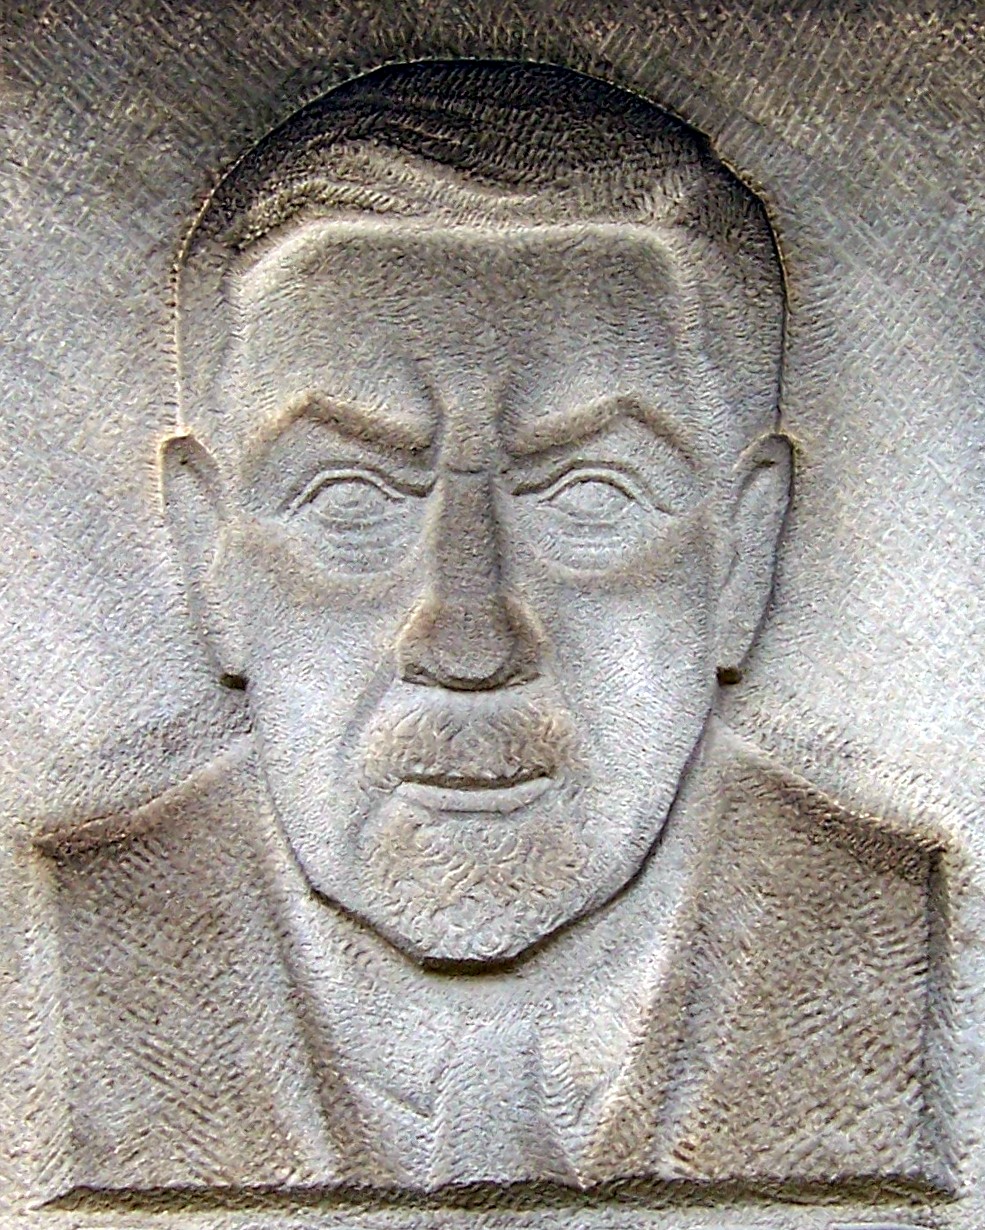
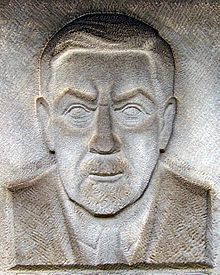
Richard Mollier

Richard Mollier (30 November 1863, Triest – 13 March 1935, Dresden) was a German professor of Applied Physics and Mechanics in Göttingen and Dresden, a pioneer of experimental research in thermodynamics, particularly for water, steam, and moist air.

Mollier diagrams (enthalpy-entropy charts) are routinely used in the design work associated with power plants (fossil or nuclear), compressors, steam turbines, refrigeration systems, and air conditioning equipment to visualize the working cycles of thermodynamic systems.

The Mollier diagram (h-s chart) of enthalpy of moist air versus its water vapor content (hx diagram) is equivalent to the Psychrometrics Chart commonly used in the USA and Britain.

Contents

Education and career

After attending Gymnasium (high school) in Triest, he commenced studies in mathematics and physics at the University of Graz (Austria), continuing at the Technische Fachschule München. He presented his first publications as an outside lecturer for Theoretical Mechanics. After a short stint in Göttingen, he succeeded Gustav Zeuner in 1897 as Professor of Mechanical Engineering at the Technischen Hochschule Dresden. His 1904 publication New Graphs for Technical Thermodynamics greatly simplified calculations involving thermodynamic processes. His New Tables and Diagrams for Water Vapor, first published in 1906, appeared in six further editions through 1932, as he updated it to reflect new developments.

Honors

At the 1923 Thermodynamics Conference held in Los Angeles, it was decided to name, in his honor, as a “Mollier graph” any thermodynamic diagram using the Enthalpy h as one of its axes. Example: the hs graph for steam or the hx graph for moist air.

Publications

  • Die Entropie der Wärme (The Entropy of Heat) 1895
  • Dampftafeln und Diagramme des Kohlendioxid (Vapor Tables and Diagrams for Carbon Dioxide) 1896
  • Neue Diagramme zur Technischen Wärmelehre (New Graphs for Technical Thermodynamics) 1904
  • Neue Tabellen und Diagramme für Wasserdampf (New Tables and Diagrams for Water Vapor) Berlin 1906

See also

External links


Wikimedia Foundation. 2010.

Игры ⚽ Поможем решить контрольную работу

Look at other dictionaries:

  • Richard Mollier — als Relief an der Außenmauer des Mollier Baus der Technischen Universität Dresden (Plakette zum 100. Geburtstag Molliers, Ausschnitt). Richard Mollier (* 30. November 1863 in Triest; † 13. März 1935 in Dresden) war Professor für angewandte Physik …   Deutsch Wikipedia

  • Richard Mollier — est un physicien et ingénieur allemand né le 30 novembre 1863 et décédé le 13 mars 1935. Il a donné son nom au diagramme de Mollier. Lien interne Thermodynamique Psychrométrie Porta …   Wikipédia en Français

  • Mollier-Diagramm —   [mɔli eː ; nach dem deutschen Maschinenbauingenieur Richard Mollier, * 1863, ✝ 1935], Bezeichnung für verschiedene Zustandsdiagramme in der Thermodynamik, bei denen die spezifische (massenbezogene) Enthalpie h von Dämpfen, Gasen oder… …   Universal-Lexikon

  • Mollier — ist der Familienname folgender Personen: Hans Mollier (1895–1971), deutscher Journalist und Schriftsteller Richard Mollier (1863–1935), Professor für angewandte Physik und Maschinenbau Diese Seite ist eine Begriffsklärung …   Deutsch Wikipedia

  • Mollier-Diagramm — Das Mollier h x Diagramm (früher i x Diagramm) ermöglicht es, Zustandsänderungen feuchter Luft durch Erwärmung, Befeuchtung, Entfeuchtung, Kühlung und Mischung verschiedener Luftmengen zu ermitteln. Das Mollier h x Diagramm gilt für einen… …   Deutsch Wikipedia

  • Mollier-h-x-Diagramm — Das Mollier h x Diagramm (früher i x Diagramm) ermöglicht es, Zustandsänderungen feuchter Luft durch Erwärmung, Befeuchtung, Entfeuchtung, Kühlung und Mischung verschiedener Luftmengen zu ermitteln. Das Mollier h x Diagramm gilt für einen… …   Deutsch Wikipedia

  • mollier diagram — ˈmȯl(ˌ)yā noun or mollier chart Usage: usually capitalized M Etymology: after Richard Mollier died 1935 German mechanical engineer : a diagram showing thermodynamic properties of a substance with various quantities (as temperature and pressure)… …   Useful english dictionary

  • Mollier diagram — /mawl yay/, Thermodynam. a graph showing the enthalpy of a substance as a function of its entropy when some physical property of the substance, as temperature or pressure, is kept at a specified constant value. [named after Richard Mollier (d.… …   Universalium

  • Enthalpy–entropy chart — The Mollier Enthalpy Entropy Diagram for water and steam. The dryness fraction , x, gives the fraction by mass of gaseous water in the wet region, the remainder being droplets of liquid. An enthalpy–entropy chart, also known as the h–s chart or… …   Wikipedia

  • H-x-Diagramm — Das Mollier h x Diagramm (früher i x Diagramm) ermöglicht es, Zustandsänderungen feuchter Luft durch Erwärmung, Befeuchtung, Entfeuchtung, Kühlung und Mischung verschiedener Luftmengen zu ermitteln. Das Mollier h x Diagramm gilt für einen… …   Deutsch Wikipedia

Share the article and excerpts

Direct link
Do a right-click on the link above
and select “Copy Link”