- De Finetti diagram
-
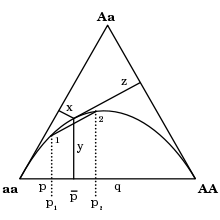 A de Finetti diagram. The curved line is the expected Hardy-Weinberg frequency as a function of p.
A de Finetti diagram is a ternary plot used in population genetics. It is named after the Italian statistician Bruno de Finetti (1906–1985) and is used to graph the genotype frequencies of populations, where there are two alleles and the population is diploid. It is based on an equilateral triangle, and Viviani's theorem concerning any point within the triangle, and the three lines from that point that are perpendicular to the sides of the triangle. The sum of the lengths of the lines is a fixed value, regardless of the position of the point. This value (the sum of the lengths) is set to be 1.
Contents
Applications in genetics
The de Finetti diagram has been put to extensive use in population genetics by A.W.F. Edwards in his book Foundations of Mathematical Genetics. In its simplest form the diagram can be used to show the range of genotype frequencies for which Hardy-Weinberg equilibrium is satisfied. A.W.F. Edwards and Chris Cannings extended its use to demonstrate the changes that occur in allele frequencies under natural selection.
See also
References
- Cannings C., Edwards A.W.F. (1968) "Natural selection and the de Finetti diagram" Ann Hum Gen 31:421-428
- Edwards, A.W.F. (2000) Foundations of Mathematical Genetics 2nd Edition, Cambridge University Press. ISBN 9780521775441
External links
- Online plotting of de Finetti diagrams for population genetics (also calculates Hardy Weinberg equilibrium statistics)

This applied mathematics-related article is a stub. You can help Wikipedia by expanding it.
