- Clarmont
-
Clarmont Country Switzerland 
Canton Vaud District Morges 46°33′N 06°27′E / 46.55°N 6.45°ECoordinates: 46°33′N 06°27′E / 46.55°N 6.45°E Population 138 (Dec 2009)[1] - Density 135 /km2 (350 /sq mi) Area 1.02 km2 (0.39 sq mi) Elevation 525 m (1,722 ft) Postal code 1127 SFOS number 5629 Mayor Jean-Pierre Imesch Surrounded by Apples, Colombier, Reverolle, Vaux-sur-Morges Website Clarmont.ch
Profile, SFSO statistics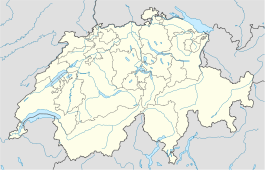
 Clarmont
View map of Clarmont Clarmont is a municipality in the Swiss canton of Vaud, located in the district of Morges.
Contents
Geography
Clarmont has an area, as of 2009[update], of 1 square kilometer (0.39 sq mi). Of this area, 0.82 km2 (0.32 sq mi) or 82.0% is used for agricultural purposes, while 0.11 km2 (0.042 sq mi) or 11.0% is forested. Of the rest of the land, 0.08 km2 (20 acres) or 8.0% is settled (buildings or roads).[2]
Of the built up area, housing and buildings made up 5.0% and transportation infrastructure made up 2.0%. Out of the forested land, 6.0% of the total land area is heavily forested and 5.0% is covered with orchards or small clusters of trees. Of the agricultural land, 67.0% is used for growing crops and 9.0% is pastures, while 6.0% is used for orchards or vine crops.[2]
The municipality was part of the old Morges District until it was dissolved on 31 August 2006, and Clarmont became part of the new district of Morges.[3]
The municipality is located on a high plateau above the Morges river.
Coat of arms
The blazon of the municipal coat of arms is Azure, a Bar wavy Argent, in chief a Sun in his splendour Or, in base a Coupeaux of the last.[4]
Demographics
Clarmont has a population (as of December 2009[update]) of 138.[1] As of 2008[update], 10.1% of the population are resident foreign nationals.[5] Over the last 10 years (1999–2009 ) the population has changed at a rate of 5.3%. It has changed at a rate of -3.8% due to migration and at a rate of 9.9% due to births and deaths.[6]
Most of the population (as of 2000[update]) speaks French (124 or 87.3%), with German being second most common (7 or 4.9%) and Italian being third (3 or 2.1%).[7]
Of the population in the municipality 40 or about 28.2% were born in Clarmont and lived there in 2000. There were 62 or 43.7% who were born in the same canton, while 18 or 12.7% were born somewhere else in Switzerland, and 21 or 14.8% were born outside of Switzerland.[7]
In 2008[update] there were 4 live births to Swiss citizens and there were 2 deaths of Swiss citizens. Ignoring immigration and emigration, the population of Swiss citizens increased by 2 while the foreign population remained the same. At the same time, there were 2 non-Swiss men who immigrated from another country to Switzerland. The total Swiss population change in 2008 (from all sources, including moves across municipal borders) was a decrease of 6 and the non-Swiss population increased by 4 people. This represents a population growth rate of -1.4%.[5]
The age distribution, as of 2009[update], in Clarmont is; 14 children or 10.1% of the population are between 0 and 9 years old and 14 teenagers or 10.1% are between 10 and 19. Of the adult population, 19 people or 13.8% of the population are between 20 and 29 years old. 23 people or 16.7% are between 30 and 39, 16 people or 11.6% are between 40 and 49, and 19 people or 13.8% are between 50 and 59. The senior population distribution is 13 people or 9.4% of the population are between 60 and 69 years old, 12 people or 8.7% are between 70 and 79, there are 8 people or 5.8% who are between 80 and 89.[8]
As of 2000[update], there were 57 people who were single and never married in the municipality. There were 65 married individuals, 5 widows or widowers and 15 individuals who are divorced.[7]
As of 2000[update] the average number of residents per living room was 0.5 which is less people per room than the cantonal average of 0.61 per room.[6] In this case, a room is defined as space of a housing unit of at least 4 m² (43 sq ft) as normal bedrooms, dining rooms, living rooms, kitchens and habitable cellars and attics.[9] About 49.2% of the total households were owner occupied, or in other words did not pay rent (though they may have a mortgage or a rent-to-own agreement).[10]
As of 2000[update], there were 65 private households in the municipality, and an average of 2.0 persons per household.[6] There were 25 households that consist of only one person and 3 households with five or more people. Out of a total of 69 households that answered this question, 36.2% were households made up of just one person and there was 1 adult who lived with their parents. Of the rest of the households, there are 18 married couples without children, 10 married couples with children There were 9 single parents with a child or children. There were 2 households that were made up of unrelated people and 4 households that were made up of some sort of institution or another collective housing.[7]
In 2000[update] there were 18 single family homes (or 45.0% of the total) out of a total of 40 inhabited buildings. There were 12 multi-family buildings (30.0%), along with 9 multi-purpose buildings that were mostly used for housing (22.5%) and 1 other use buildings (commercial or industrial) that also had some housing (2.5%). Of the single family homes 7 were built before 1919, while 1 was built between 1990 and 2000. The most multi-family homes (4) were built before 1919 and the next most (2) were built between 1946 and 1960. There was 1 multi-family house built between 1996 and 2000.[11]
In 2000[update] there were 76 apartments in the municipality. The most common apartment size was 3 rooms of which there were 25. There were 3 single room apartments and 22 apartments with five or more rooms. Of these apartments, a total of 65 apartments (85.5% of the total) were permanently occupied, while 9 apartments (11.8%) were seasonally occupied and 2 apartments (2.6%) were empty.[11] As of 2009[update], the construction rate of new housing units was 0 new units per 1000 residents.[6] The vacancy rate for the municipality, in 2010[update], was 1.28%.[6]
The historical population is given in the following chart:[12][13]

Politics
In the 2007 federal election the most popular party was the SP which received 20.25% of the vote. The next three most popular parties were the LPS Party (18.15%), the SVP (18.02%) and the Green Party (15.19%). In the federal election, a total of 46 votes were cast, and the voter turnout was 47.4%.[14]
Economy
As of 2010[update], Clarmont had an unemployment rate of 1.8%. As of 2008[update], there were 30 people employed in the primary economic sector and about 7 businesses involved in this sector. 2 people were employed in the secondary sector and there were 2 businesses in this sector. 12 people were employed in the tertiary sector, with 4 businesses in this sector.[6] There were 80 residents of the municipality who were employed in some capacity, of which females made up 46.3% of the workforce.
In 2008[update] the total number of full-time equivalent jobs was 31. The number of jobs in the primary sector was 18, all of which were in agriculture. The number of jobs in the secondary sector was 2, of which 1 was in manufacturing and 1 was in construction. The number of jobs in the tertiary sector was 11. In the tertiary sector; 3 or 27.3% were in the sale or repair of motor vehicles and 7 or 63.6% were technical professionals or scientists.[15]
In 2000[update], there were 67 workers who commuted away from the municipality.[16] Of the working population, 8.8% used public transportation to get to work, and 75% used a private car.[6]
Religion
From the 2000 census[update], 33 or 23.2% were Roman Catholic, while 82 or 57.7% belonged to the Swiss Reformed Church. Of the rest of the population, there were 8 individuals (or about 5.63% of the population) who belonged to another Christian church. There was 1 individual who was Jewish, and there was 1 individual who belonged to another church. 15 (or about 10.56% of the population) belonged to no church, are agnostic or atheist, and 6 individuals (or about 4.23% of the population) did not answer the question.[7]
Education
In Clarmont about 62 or (43.7%) of the population have completed non-mandatory upper secondary education, and 19 or (13.4%) have completed additional higher education (either University or a Fachhochschule). Of the 19 who completed tertiary schooling, 47.4% were Swiss men, 31.6% were Swiss women.[7]
In the 2009/2010 school year there were a total of 15 students in the Clarmont school district. In the Vaud cantonal school system, two years of non-obligatory pre-school are provided by the political districts.[17] During the school year, the political district provided pre-school care for a total of 631 children of which 203 children (32.2%) received subsidized pre-school care. The canton's primary school program requires students to attend for four years. There were 9 students in the municipal primary school program. The obligatory lower secondary school program lasts for six years and there were 6 students in those schools.[18]
As of 2000[update], there were 23 students from Clarmont who attended schools outside the municipality.[16]
References
- ^ a b Swiss Federal Statistical Office, MS Excel document – Bilanz der ständigen Wohnbevölkerung nach Kantonen, Bezirken und Gemeinden (German) accessed 25 August 2010
- ^ a b Swiss Federal Statistical Office-Land Use Statistics 2009 data (German) accessed 25 March 2010
- ^ Nomenklaturen – Amtliches Gemeindeverzeichnis der Schweiz (German) accessed 4 April 2011
- ^ Flags of the World.com accessed 23-June-2011
- ^ a b Swiss Federal Statistical Office - Superweb database - Gemeinde Statistics 1981-2008 (German) accessed 19 June 2010
- ^ a b c d e f g Swiss Federal Statistical Office accessed 23-June-2011
- ^ a b c d e f STAT-TAB Datenwürfel für Thema 40.3 - 2000 (German) accessed 2 February 2011
- ^ Canton of Vaud Statistical Office (French) accessed 29 April 2011
- ^ Eurostat. "Housing (SA1)" (pdf). Urban Audit Glossary. 2007. p. 18. http://www.bfs.admin.ch/bfs/portal/en/index/international/22/lexi.Document.116365.pdf. Retrieved 12 February 2010.
- ^ Urban Audit Glossary pg 17
- ^ a b Swiss Federal Statistical Office STAT-TAB - Datenwürfel für Thema 09.2 - Gebäude und Wohnungen (German) accessed 28 January 2011
- ^ Clarmont in German, French and Italian in the online Historical Dictionary of Switzerland.
- ^ Swiss Federal Statistical Office STAT-TAB Bevölkerungsentwicklung nach Region, 1850-2000 (German) accessed 29 January 2011
- ^ Swiss Federal Statistical Office, Nationalratswahlen 2007: Stärke der Parteien und Wahlbeteiligung, nach Gemeinden/Bezirk/Canton (German) accessed 28 May 2010
- ^ Swiss Federal Statistical Office STAT-TAB Betriebszählung: Arbeitsstätten nach Gemeinde und NOGA 2008 (Abschnitte), Sektoren 1-3 (German) accessed 28 January 2011
- ^ a b Swiss Federal Statistical Office - Statweb (German) accessed 24 June 2010
- ^ Organigramme de l'école vaudoise, année scolaire 2009-2010 (French) accessed 2 May 2011
- ^ Canton of Vaud Statistical Office - Scol. obligatoire/filières de transition (French) accessed 2 May 2011
Aclens | Allaman | Apples | Aubonne | Ballens | Berolle | Bière | Bougy-Villars | Bremblens | Buchillon | Bussy-Chardonney | La Chaux (Cossonay) | Chavannes-le-Veyron | Chevilly | Chigny | Clarmont | Cossonay | Cottens | Cuarnens | Denens | Denges | Dizy | Echandens | Echichens | Eclépens | Etoy | Féchy | Ferreyres | Gimel | Gollion | Grancy | L’Isle | Lavigny | Lonay | Lully | Lussy-sur-Morges | Mauraz | Moiry | Mollens | Montherod | Mont-la-Ville | Montricher | Morges | Orny | Pampigny | Pizy | Pompaples | Préverenges | Reverolle | Romanel-sur-Morges | Saint-Livres | Saint-Oyens | Saint-Prex | La Sarraz | Saubraz | Senarclens | Sévery | Tolochenaz | Vaux-sur-Morges | Villars-sous-Yens | Vufflens-le-Château | Vullierens | Yens
Canton of Vaud | Municipalities of the canton of Vaud | Switzerland


Wikimedia Foundation. 2010.