- North Wales (National Assembly for Wales electoral region)
-
North Wales Welsh Assembly electoral region 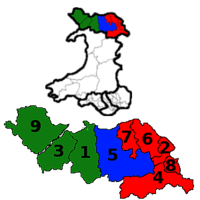
North Wales shown within Wales Created
1999Current representation Welsh Labour Party 5 AMs Conservative Party 4 AMs Plaid Cymru 3 AMs Liberal Democrats 1 AM Constituencies
1. Aberconwy
2. Alyn and Deeside
3. Arfon
4. Clwyd South
5.Clwyd West
6. Delyn
7. Vale of Clwyd
8. Wrexham
9. Ynys MônPreserved counties
Clwyd (part)
Gwynedd (part)
Powys (part)North Wales is an electoral region of the National Assembly for Wales, consisting of nine constituencies. The region elects thirteen members, nine directly elected constituency members and four additional members. The electoral region was first used in the 1999 Welsh Assembly election, when the Assembly for Wales was created.
Each constituency elects one Assembly Member by the first past the post electoral system, and the region as a whole elects four additional or top-up Assembly Members, to create a degree of proportional representation. The additional member seats are allocated from closed lists by the d'Hondt method, with constituency results being taken into account in the allocation.
County and Westminster boundaries
As created in 1999, the region covered the most of the preserved county of Clwyd, part of the preserved county of Gwynedd, and part of the preserved county of Powys. Other parts of these preserved counties were within the Mid and West Wales electoral region. For the 2007 Welsh Assembly election, however, boundaries changed, and the region now covers all of the preserved county of Clwyd and part of the preserved county of Gwynedd. The rest of Gwynedd is in the Mid and West Wales region.
The Assembly constituencies have the names of constituencies of the House of Commons of the Parliament of the United Kingdom (Westminster). For Westminster election purposes, however, there are no electoral regions, and constituency boundary changes became effective for the 2010 United Kingdom general election.
Electoral region profile
The region is a mix of rural and urban areas, with the population higher in the east, where can be found the region's largest town, Wrexham, and the working-class conurbations of Deeside. The western areas, including the Isle of Anglesey (Ynys Mon), are largely rural. Although Anglesey and Gwynedd are home to large numbers of Welsh speakers, the language is not widely spoken in the north-east.
Constituencies
Constituency 2011 Result Preserved county Aberconwy Janet Finch-Saunders
ConservativeEntirely within Clwyd Alyn and Deeside Carl Sargeant
LabourArfon Alun Ffred Jones
Plaid CymruEntirely within Gwynedd Clwyd South Ken Skates
LabourEntirely within Clwyd Clwyd West Darren Millar
ConservativeDelyn Sandy Mewies
LabourVale of Clwyd Ann Jones
LabourWrexham Lesley Griffiths
LabourYnys Môn Ieuan Wyn Jones
Plaid CymruEntirely within Gwynedd 2011 Welsh Assembly election additional members
Party Constituency Seats List Votes (vote %) D'Hondt Entitlement Additional Members Elected Total Members Elected Deviation from D'Hondt Entitlement Labour 5 62,677 (32.2%) 5 0 5 0 Conservative 2 52,201 (26.8%) 4 2 4 0 Plaid Cymru 2 41,701 (21.4%) 3 1 3 0 Liberal Democrats 0 11,507 (5.9%) 1 1 1 0 UKIP 0 9,608 (4.9%) 0 0 0 0 Socialist Labour 0 4,895 (2.5%) 0 0 0 0 BNP 0 4,785 (2.5%) 0 0 0 0 Green 0 4,406 (2.3%) 0 0 0 0 Welsh Christian 0 1,401 (0.7%) 0 0 0 0 Jason Weyman - Independent 0 1,094 (0.6%) 0 0 0 0 Communist 0 523 (0.3%) 0 0 0 0 2007 Welsh Assembly election additional members[1]
Party Constituency Seats List Votes (vote %) D'Hondt Entitlement Additional Members Elected Total Members Elected Deviation from D'Hondt Entitlement Labour 5 51,831 (26.4%) 4 0 5 +1 Plaid Cymru 3 50,558 (25.7%) 4 1 4 0 Conservative 1 50,266 (25.6%) 4 2 3 -1 Liberal Democrats 0 15,275 (7.8%) 1 1 1 0 BNP 0 9,986 (5.1%) 0 0 0 0 UKIP 0 8,015 (4.1%) 0 0 0 0 Green 0 5,660 (2.9%) 0 0 0 0 Socialist Labour 0 2,209 (1.1%) 0 0 0 0 Welsh Christian 0 1,300 (0.7%) 0 0 0 0 Communist 0 700 (0.4%) 0 0 0 0 Christian Peoples 0 642 (0.3%) 0 0 0 0 2003 Welsh Assembly election additional members[2]
Party Constituency Seats List Votes (vote %) D'Hondt Entitlement Additional Members Elected Total Members Elected Deviation from D'Hondt Entitlement Labour 6 55,250 (31.57%) 6 0 6 0 Plaid Cymru 2 41,640 (23.79%) 3 1 3 0 Conservative 0 38,543 (22.02%) 2 2 2 0 Liberal Democrats 0 17,503 (10.00%) 1 1 1 0 Independent- John Marek 1 11,008 (6.29.%) 1 0 1 0 UKIP 0 4,500 (2.57%) 0 0 0 0 Green 0 4,200 (2.40%) 0 0 0 0 Cymru Annibynnol 0 1,552 (0.89%) 0 0 0 0 Communist 0 522 (0.30%) 0 0 0 0 ProLife Alliance 0 310 (0.18%) 0 0 0 0 Former constituencies
1999 to 2007
Constituency Preserved counties Alyn and Deeside Entirely within Clwyd Caernarfon Entirely within Gwynedd Clwyd South Partly Clwyd, partly Powys Clwyd West Entirely within Clwyd Conwy Partly Clwyd, partly Gwynedd Delyn Entirely within Clwyd Vale of Clwyd Wrexham Ynys Môn Entirely within Gwynedd 1999 Welsh Assembly election additional members[3]
Party Constituency Seats List Votes (vote %) D'Hondt Entitlement Additional Members Elected Total Members Elected Deviation from D'Hondt Entitlement Labour 7 70,625 (41.79%) 0 0 7 0 Plaid Cymru 0 50,757 (30.04%) 2 2 2 0 Conservative 0 20,993 (12.42%) 1 1 1 0 Liberal Democrats 0 18,527 (10.96%) 1 1 1 0 Green 0 4,082 (2.42%) 0 0 0 0 People's Representative 0 2,074 (1.23%) 0 0 0 0 Socialist Alliance 0 1,257 (0.74%) 0 0 0 0 Natural Law 0 676 (0.40%) 0 0 0 0 References
Electoral regions and Constituencies of the National Assembly for Wales 
Mid and West Wales North Wales Aberconwy · Alyn and Deeside · Arfon · Clwyd South · Clwyd West · Delyn · Vale of Clwyd · Wrexham · Ynys MônSouth Wales Central South Wales East Blaenau Gwent · Caerphilly · Islwyn · Merthyr Tydfil and Rhymney · Monmouth · Newport East · Newport West · TorfaenSouth Wales West Categories:- National Assembly for Wales electoral regions

Wikimedia Foundation. 2010.