- Storm Prediction Center
-
Storm Prediction Center 
The Storm Prediction Center logo. Agency overview Formed October 1995 Preceding agencies National Severe Storms Forecast Center (1966–1995)
SELS (1953–1966)Jurisdiction Federal government of the United States Headquarters Norman, Oklahoma Employees 43 Agency executive Russell Schneider, Director Parent agency National Centers for Environmental Prediction Website http://www.spc.noaa.gov/ The Storm Prediction Center (SPC), located in Norman, Oklahoma, is tasked with forecasting the risk of severe thunderstorms and tornadoes in the contiguous United States. The agency issues convective outlooks, mesoscale discussions, and watches as a part of this process. Convective outlooks are issued for Day 1, Day 2, Day 3, and Day 4–8, and detail the risk of severe thunderstorms and tornadoes during the given forecast period, although tornado, hail, and wind details are only available for Day 1. Days 2 and 3, as well as 4–8 used a probabilistic scale, determining the probability for a severe weather event in percent. Mesoscale discussions are issued to give information on a region that is becoming a severe weather threat and states whether a watch is likely and details thereof, as well as situations of isolated severe weather when watches are not necessary. Watches are issued when forecasters are confident that severe weather will occur, and usually precede the onset of severe weather by one hour.
The agency is also responsible for forecasting fire weather (conditions favorable for wildfires) in the contiguous US, and issues Day 1, 2, and 3–8 fire weather outlooks. These outlooks detail areas with critical or extremely critical fire conditions.
The Storm Prediction Center is part of the National Centers for Environmental Prediction (NCEP), operating under the control of the National Weather Service (NWS), which in turn is part of the National Oceanic and Atmospheric Administration (NOAA) of the United States Department of Commerce (DoC).
The Storm Prediction Center was previously known as the National Severe Storms Forecast Center and was located in Kansas City, Missouri. In October 1995, the National Severe Storms Forecast Center relocated to Norman and was renamed the Storm Prediction Center. From the time of the move until 2006, it was co-located with the National Severe Storms Laboratory at University of Oklahoma Westheimer Airport. In 2006, they moved into the National Weather Center.
Contents
History
The Storm Prediction Center began in 1952 in Washington, D.C. as SELS (Severe Local Storms Unit), a special unit of forecasters in the Weather Bureau. In 1954, the unit moved to Kansas City. SELS began issuing convective outlooks in 1955, and began issuing radar summaries every three hours in 1960;[1] with the increased duties of radar summaries this unit became the National Severe Storms Forecast Center (NSSFC) in 1966.[2]
In 1968 the National Severe Storms Forecast Center began issuing status reports on watches, and in 1971 the agency made their first computerized data transmission.[1] On April 2, 1982 the first particularly dangerous situation watch was issued.[1] Two new products were introduced in 1986: the Day 2 Convective Outlook and the Mesoscale Discussion.[1]
The National Severe Storms Forecast Center remained located in Kansas City, Missouri until October 1995, when it moved to Norman, Oklahoma and was renamed the Storm Prediction Center.[3] In 1998, the Center began issuing the National Fire Weather Outlook.[1] The Day 3 Convective Outlook was first issued on an experimental basis in 2000, and was made an official product in 2001.[1] From 1995 to 2006 the Storm Prediction Center was housed at University of Oklahoma Westheimer Airport,[3] in the same building as the National Severe Storms Laboratory, after which it moved to the National Weather Center.[1]
The Storm Prediction Center continues operations out of the National Weather Center building as of 2011.[4]
Overview
The Storm Prediction Center is responsible for forecasting the risk of severe weather caused by severe thunderstorms, specifically those producing tornadoes, hail 1 inch (2.5 cm) or larger, and winds 58 mph (93 km/h) or greater. The agency also forecasts hazardous winter and fire weather. It does so primarily by issuing convective outlooks, severe thunderstorm watches, tornado watches, and mesoscale discussions.[5]
There is a three-stage process in which the area, time period, and details of a severe weather forecast are refined from a broad-scale forecast of potential hazards to a more specific and detailed forecast of what hazards are expected, where they are expected to occur, and in what time frame. If warranted, forecasts will also increase in severity through this three-stage process.[5]
The Storm Prediction Center employs a total of 43 personnel, including five lead forecasters, ten mesoscale/outlook forecasters, and seven assistant mesoscale forecasters.[6]
The Storm Prediction Center is part of the National Centers for Environmental Prediction (NCEP), operating under the control of the National Weather Service (NWS),[3] which in turn is part of the National Oceanic and Atmospheric Administration (NOAA) of the United States Department of Commerce (DoC).[7]
Many SPC forecasters and support staff are heavily involved in scientific research into severe and hazardous weather. This involves conducting applied research and writing technical papers, developing training materials, giving seminars and other presentations locally and nationwide, attending scientific conferences, and participating in weather experiments.[8]
Convective outlooks
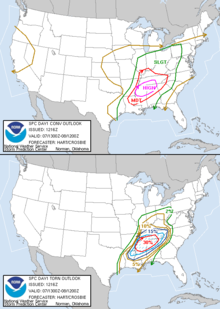 Day 1 Convective Outlook and Probabilistic maps issued by the Storm Prediction Center during the heart of a tornado outbreak on April 7, 2006. The top map indicates the risk of general severe weather (including large hail, damaging winds, and tornadoes), while the bottom map specifically shows the percent risk of a tornado forming within 25 miles (40 km) of any point within the enclosed area. The hatched area on the bottom map indicates a 10% or greater risk of an F2 or stronger tornado forming within 25 miles (40 km) of a point.
The Storm Prediction Center issues categorical and probability forecasts describing the general threat of severe convective storms over the contiguous United States for the next 6–192 hours (Day 1–Day 8). They are labeled and issued by day and are issued up to five times a day.[9]
The categorical risks are general thunderstorms (green shaded area/previously brown line before April 2011), "SEE TEXT" (black, textual label on map indicating potential for isolated severe storms or near-severe storms), "SLGT" (yellow shaded area/previously green line indicating slight risk of severe weather), "MDT" (red shaded area/previously red line indicating moderate risk of severe weather), and "HIGH" (pink shaded area/previously fuchsia line indicating high risk of severe weather). Significant severe areas (referred to as "hatched areas" because of their representation on outlook maps) refer to a threat of increased storm intensity that is of "significant severe" (F2/EF2 or stronger tornado, 2 inches (5 cm) or larger hail, or 75 mph (120 km/h) winds or greater) level.[10]
In April of 2011, the SPC began issuing new graphics for categorical and probabilistic outlooks. The new format includes shading of risk areas and population, county, and interstate overlays. The colors were changed as mentioned above as well. The new shaded maps also include changes to the probability color shades on each outlook.
Public severe weather outlooks (PWO) are issued when a significant or widespread outbreak is expected, especially for tornadoes. From November to March, it can also be issued for any threat of significant tornadoes in the nighttime hours, noting the lower awareness and greater danger of tornadoes at that time of year.[11]
Categories
A slight risk day typically will mean the threat exists for scattered severe weather, including scattered wind damage or severe hail and possibly some isolated tornadoes. During the peak severe weather season, most days will have a slight risk somewhere in the US. Isolated significant severe events are possible in some circumstances, but are generally not widespread.[9]
A moderate risk day indicates that more widespread and/or more dangerous severe weather is possible (sometimes with major hurricanes), with significant severe weather often more likely. Numerous tornadoes (including some strong tornadoes), more widespread or severe wind damage and very large/destructive hail could occur. Major events, such as large tornado outbreaks, are sometimes also possible on moderate risk days, but with greater uncertainty. Moderate risk days are not uncommon and typically occur several times a month, especially during peak season. A slight risk area typically surrounds a moderate risk area, where the threat is lower.[9]
A high risk day indicates a considerable likelihood of a major tornado outbreak or (much less often) an extreme derecho event. On these days, the potential exists for extremely severe and life-threatening weather, including widespread strong or violent tornadoes and/or very destructive straight-line winds (Hail cannot verify or produce a high risk on its own, although such a day usually involves a threat for widespread very large hail as well). Many of the most prolific severe weather days were high risk days. Such days are quite rare; a high risk is typically issued only a few times each year (see List of SPC High Risk days). High risk areas are usually surrounded by a larger moderate risk area, where uncertainty is greater or the threat is somewhat lower.[9]
Issuance and usage
Note: SIGNIFICANT SEVERE area needed where denoted by bold italic type – otherwise default to next lower category.
Day 1 probability to categorical outlook conversion[10] Outlook probability TORN WIND HAIL 2% see text not used not used 5% SLGT see text see text 10% SLGT not used not used 15% MDT SLGT SLGT 30% HIGH SLGT SLGT 45% HIGH MDT MDT 60% HIGH HIGH MDT Day 2 probability to categorical outlook conversion[10] Outlook probability Combined TORN, WIND, and HAIL 5% see text 15% SLGT 30% SLGT 45% MDT 60% HIGH Day 3 probability to categorical outlook conversion[10] Outlook probability Combined TORN, WIND, and HAIL 5% see text 15% SLGT 30% SLGT 45% MDT Convective outlooks are issued in Zulu time (also known as UTC).[10]
The categories at right refer to the risk levels for the specific severe weather event occurring within 25 miles (40 km) of any point in the delineated region. SLGT is slight risk, meaning that well organized severe thunderstorms are expected, but low in number or coverage. MDT moderate risk, indicating that greater concentration and magnitude of severe weather is expected than would be expected in a slight risk. HIGH a high risk of severe weather, and indicates that a major severe weather outbreak is expected, with a high concentration of severe weather and enhanced risk of extremely severe weather. On high risk days the potential exists for 20 or more tornadoes (with some EF2 or stronger possible) or a extreme derecho (with winds of 80 miles per hour (130 km/h) or greater possible).[10] SEE TEXT means that there is a threat for severe weather, but the threat is not high enough to warrant a slight risk.[10]
The Day 1 Convective Outlook, issued five times per day at 0600Z (valid 1200Z that day until 1200Z the following day), 1300Z and 1630Z (the "morning updates," valid until 1200Z the next day), 2000Z (the "afternoon update," valid until 1200Z the next day), and the 0100Z (the "evening update," valid until 1200Z the following day), provides a textual forecast, map of categories and probabilities, and chart of probabilities. The Day 1 is currently the only outlook to issue probabilities specifically for tornadoes, hail, or wind. It is the most descriptive and highest accuracy outlook.[9]
Day 2 outlooks, issued twice daily at 0600Z and 1730Z, refer to tomorrow's weather (1200Z–1200Z of the next calendar day; for example a day 2 outlook issued on April 12, 2100 would be valid from 1200Z April 13, 2100 through 1200Z April 14, 2100) and include only a categorical outline, textual description, and a probability graph for severe convective storms generally. Day 2 moderate risks are fairly uncommon, and a Day 2 high risk has only been issued once (for April 7, 2006).[9]
Day 3 outlooks refer to the day after tomorrow, and include the same products (categorical outline, text description, and probability graph) as the Day 2 outlook. Higher probability forecasts are less and less likely as the forecast period increases due to lessening forecast ability farther in advance. No attempt is made to forecast general thunderstorms and a high risk is never issued that far out. Day 3 moderate risks are also quite rare; it has been used only ten times since the product became operational (most recently for April 27, 2011).[9][12]
Day 4–8 outlooks are the longest-term official SPC Forecast Product, and often change significantly from day to day. They were an experimental product until March 22, 2007 when they became an official product. Areas are delineated in this forecast that have least a 30% chance of severe weather in the day 4–8 period (equivalent to a mid-range slight risk).[9]
Local forecast offices of the National Weather Service, radio and television stations, and emergency planners often use the forecasts to gauge the potential severe weather threats to their areas.[9]
Mesoscale discussions
Mesoscale discussions (MCDs) generally precede a tornado watch or severe thunderstorm watch, by 1–3 hours when possible.[13] Mesoscale discussions are designed to give local forecasters an update on a region where a severe weather threat is emerging and an indication of whether a watch is likely and details thereof, as well as situations of isolated severe weather when watches are not necessary.[13] MCDs contain meteorological information on what is happening and what is expected to happen in the next few hours, and forecast reasoning in regard to weather watches.[13] Mesoscale discussions are often issued to update information on watches already issued, and sometimes when one is to be canceled. Mesoscale discussions are also issued for winter weather and heavy rainfall events.[13]
Example
 Graphic associated with the example mesoscale discussion.[14]
MESOSCALE DISCUSSION 0685
- NWS STORM PREDICTION CENTER NORMAN OK
- 0253 PM CDT FRI MAY 04 2007
- AREAS AFFECTED...WRN KS...PARTS OF WRN OK/ERN TX PNHDL
- CONCERNING...SEVERE POTENTIAL...TORNADO WATCH LIKELY
- VALID 041953Z - 042200Z
- TRENDS ARE BEING CLOSELY MONITORED FOR SIGNS OF CONVECTIVE
- INITIATION. ALTHOUGH TIMING IS STILL A BIT UNCERTAIN...ONE OR MORE
- TORNADO WATCHES WILL PROBABLY BE REQUIRED LATE THIS AFTERNOON.
- MOISTENING SOUTHERLY LOW-LEVEL FLOW AND STRONG DAYTIME HEATING ALONG
- SOUTHERN HIGH PLAINS DRY LINE...INTO THE VICINITY OF WEAK SURFACE
- LOW OVER SOUTHWEST KANSAS...IS CONTRIBUTING TO STRONG
- DESTABILIZATION. RUC GUIDANCE INDICATES MIXED LAYER CAPE IS
- INCREASING INTO THE 3000-4000 J/KG RANGE...THOUGH MID-LEVEL
- SUBSIDENCE/SHORT WAVE RIDGING ALOFT IS CURRENTLY INHIBITING
- CONVECTIVE DEVELOPMENT.
- HOWEVER...MID/UPPER FORCING ASSOCIATED WITH AN IMPULSE LIFTING OUT
- OF AMPLIFIED WESTERN TROUGH IS BEGINNING TO SHIFT EAST OF THE
- CENTRAL/SOUTHERN ROCKIES. AND...LATEST RUC GUIDANCE SUGGESTS WEAK
- LOWER/MID TROPOSPHERIC COOLING HAS OCCURRED ACROSS WESTERN KANSAS
- INTO THE TEXAS PANHANDLE ASSOCIATED WITH IMPULSE ALREADY LIFTING
- NORTHWARD THROUGH THE NORTH CENTRAL HIGH PLAINS. ALTHOUGH
- UNCERTAINTY DOES EXISTS CONCERNING TIMING OF CONVECTIVE
- INITIATION...MUCH OF MODEL GUIDANCE SUGGESTS THAT THIS COULD OCCUR
- AS EARLY AS 22-23Z. THIS SEEMS MOST PROBABLE WHERE FORCING WILL BE
- STRONGEST NEAR SURFACE LOW...BUT INITIATION OF WIDELY SCATTERED
- STORMS MAY QUICKLY FOLLOW SUIT.
- STORM DEVELOPMENT/INTENSIFICATION WILL LIKELY BE VERY RAPID ONCE CAP
- BREAKS. AND...LARGE CLOCKWISE CURVED LOW-LEVEL HODOGRAPHS BENEATH
- 40-50 KT CYCLONIC WEST SOUTHWESTERLY 500 MB FLOW WILL BE FAVORABLE
- FOR TORNADOES...IN ADDITION TO THE RISK OF VERY LARGE HAIL.
- ISOLATED STRONG TORNADOES ARE POSSIBLE...PARTICULARLY AS LOW-LEVEL
- JET STRENGTHENS NEAR/SHORTLY AFTER 04/00-01Z.
- ..KERR.. 05/04/2007
- ATTN...WFO...ICT...OUN...GID...DDC...GLD...LUB...AMA...
Source:[14]Weather watches
Main articles: Tornado watch and Severe thunderstorm watchWatches issued by the SPC are generally less than 20,000–50,000 square miles (52,000–130,000 km2) in area and are normally preceded by a mesoscale discussion.[15] Watches are intended to be issued preceding arrival of severe weather by 1–6 hours.[15] They indicate that conditions are favorable for severe thunderstorms or tornadoes. In the case of severe thunderstorm watches organized severe thunderstorms are expected but conditions are not thought to be especially favorable for tornadoes, whereas for tornado watches conditions are thought favorable for severe thunderstorms producing tornadoes.[15] In situations where a forecaster expects a significant threat of extremely severe and life-threatening weather, a watch with special wording of "particularly dangerous situation" (PDS) is subjectively issued.[16] It is occasionally issued with tornado watches, normally for the potential of major tornado outbreaks.[16] A PDS severe thunderstorm watch is very rare and usually issued for the potential of major derecho events.[16]
Watches are not 'Warnings', where there is an immediate severe weather threat to life and property. Although Severe Thunderstorm and Tornado Warnings are ideally the next step after watches, watches cover a threat of organized severe thunderstorms over a larger area and may not always precede a warning. Warnings are issued by local National Weather Service offices, not the Storm Prediction Center, which is a national guidance center.[15]
Watches are canceled by the local National Weather Service office.[15]
Example
 Graphic associated with the example watch.[17]
- URGENT — IMMEDIATE BROADCAST REQUESTED
- TORNADO WATCH NUMBER 232
- NWS STORM PREDICTION CENTER NORMAN OK
- 955 AM CDT SAT MAY 5 2007
- THE NWS STORM PREDICTION CENTER HAS ISSUED A
- TORNADO WATCH FOR PORTIONS OF
-
-
- PARTS OF WESTERN AND CENTRAL KANSAS
- PARTS OF SOUTHWEST AND CENTRAL NEBRASKA
-
- EFFECTIVE THIS SATURDAY MORNING AND EVENING FROM 955 AM UNTIL
- 1000 PM CDT.
- ...THIS IS A PARTICULARLY DANGEROUS SITUATION...
- DESTRUCTIVE TORNADOES...LARGE HAIL TO 4 INCHES IN DIAMETER...
- THUNDERSTORM WIND GUSTS TO 90 MPH...AND DANGEROUS LIGHTNING ARE
- POSSIBLE IN THESE AREAS.
- THE TORNADO WATCH AREA IS APPROXIMATELY ALONG AND 100 STATUTE
- MILES EAST AND WEST OF A LINE FROM 45 MILES NORTH NORTHWEST OF
- BROKEN BOW NEBRASKA TO 55 MILES SOUTHWEST OF RUSSELL KANSAS. FOR
- A COMPLETE DEPICTION OF THE WATCH SEE THE ASSOCIATED WATCH
- OUTLINE UPDATE (WOUS64 KWNS WOU2).
- REMEMBER...A TORNADO WATCH MEANS CONDITIONS ARE FAVORABLE FOR
- TORNADOES AND SEVERE THUNDERSTORMS IN AND CLOSE TO THE WATCH
- AREA. PERSONS IN THESE AREAS SHOULD BE ON THE LOOKOUT FOR
- THREATENING WEATHER CONDITIONS AND LISTEN FOR LATER STATEMENTS
- AND POSSIBLE WARNINGS.
- DISCUSSION...VERY POTENT TORNADIC SUPERCELL PATTERN IN PLACE ACROSS
- WATCH AREA AS AIR MASS IS EXTREMELY UNSTABLE WITH VERY FAVORABLE
- SHEAR PROFILES. WITH LITTLE INHIBITION REMAINING ALONG E OF DRY
- LINE...STORMS WILL RAPIDLY BECOME SEVERE BY EARLY THIS AFTERNOON WRN
- KS INTO SWRN NEB. TORNADIC SUPERCELLS WILL DEVELOP WITH POTENTIAL
- FOR LONG TRACK/VIOLENT TORNADOS. AS DRY LINE REMAINS WRN KS THRU
- THE AFTERNOON...ADDITIONAL DEVELOPMENT OF TORNADIC SUPERCELLS ARE
- LIKELY OFF THE DRY LINE THRU THE EVENING HOURS.
- AVIATION...TORNADOES AND A FEW SEVERE THUNDERSTORMS WITH HAIL
- SURFACE AND ALOFT TO 4 INCHES. EXTREME TURBULENCE AND SURFACE
- WIND GUSTS TO 80 KNOTS. A FEW CUMULONIMBI WITH MAXIMUM TOPS TO
- 600. MEAN STORM MOTION VECTOR 22040.
- ...HALES
Source:[17]Fire weather products
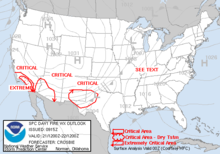 An example of a Day 1 fire outlook, issued in the midst of the October 2007 California wildfires.
The Storm Prediction Center also is responsible for issuing fire weather outlooks for the continental United States. These outlooks are a guidance product for local, state, and federal government agencies, including local National Weather Service offices, in forecasting the potential for wildfires.[18] The outlooks issued are for day 1, day 2, and days 3–8. The day 1 product is issued at 4:00 a.m. Central time and is updated at 1700Z, and is valid from 1200Z to 1200Z the following day. The day 2 outlook is issued at 1000Z and is updated at 2000Z for the forecast period of 1200Z to 1200Z the following day. The day 3–8 outlook is issued at 2200Z and is valid for days 3–8.[18]
There are four types of Fire Weather Outlook areas: "See Text", a "Critical Fire Weather Area for Wind and Relative Humidity", an "Extremely Critical Fire Weather Area for Extreme Conditions of Wind and Relative Humidity", and a "Critical Fire Weather Area for Dry Thunderstorms".[19] The outlook type depends on forecast weather conditions, severity of the predicted threat, and local climatology of a forecast region.[18] "See Text" is a label on the map for pointing out areas where fire potential is great enough to pose a limited threat, but not enough to warrant a critical area, similar to "See Text" areas in convective outlooks. Critical Fire Weather Areas for Wind and Relative Humidity are typically issued when strong winds (>20 mph) and low Relative Humidity are expected to occur where dried fuels exist, similar to a slight or moderate risk of severe weather. Critical Fire Weather Areas for Dry Thunderstorms are typically issued when widespread or numerous thunderstorms producing little wetting rain (<0.10 in) are expected to occur where dried fuels exist. Extremely Critical Fire Weather Areas for Wind and Relative Humidity are issued when very strong winds and very low RH are expected to occur with very dry fuels. Extremely Critical areas are rarely issued, similar to the very low frequency of high risk areas in convective outlooks.[19]
See also
References
- ^ a b c d e f g Edwards, Roger; Fred Ostby (2009). "Timeline of SELS and SPC". Storm Prediction Center. http://www.spc.noaa.gov/history/timeline.html. Retrieved 2010-02-02.
- ^ Stephen F. Corfidi (August 1999). "The Birth and Early Years of the Storm Prediction Center". Weather and Forecasting (American Meteorological Society) 14 (4): 507–525. Bibcode 1999WtFor..14..507C. doi:10.1175/1520-0434(1999)014<0507:TBAEYO>2.0.CO;2. ISSN 1520-0434. http://ams.allenpress.com/perlserv/?request=get-document&doi=10.1175%2F1520-0434%281999%29014%3C0507%3ATBAEYO%3E2.0.CO%3B2.
- ^ a b c Stephen F. Corfidi (2009-12-27). "A brief history of the Storm Prediction Center". Storm Prediction Center. National Oceanic and Atmospheric Administration. http://www.spc.noaa.gov/history/early.html. Retrieved 2010-01-31.
- ^ Carbin, Greg; Roger Edwards, Greg Grosshans, David Imy, Mike Kay, Jay Liang, Joe Schaefer, Rich Thompson. "Frequently Asked Questions (FAQ)". Storm Prediction Center Frequently Asked Questions. Storm Prediction Center. http://www.spc.noaa.gov/faq/. Retrieved 2010-05-13.
- ^ a b Storm Prediction Center. "The Severe Storms Forecast Process: Outlook to Mesoscale Discussion to Watch to Warning". About the Storm Prediction Center. Storm Prediction Center. http://www.spc.noaa.gov/misc/aboutus.html. Retrieved 2009-12-27.
- ^ "Storm Prediction Center Employees". spc.noaa.gov. Storm Prediction Center. http://www.spc.noaa.gov/staff/. Retrieved 2010-04-08.
- ^ "NOAA's National Weather Service". weather.gov. National Weather Service. http://www.weather.gov. Retrieved 2010-05-13.
- ^
 This article incorporates public domain material from the Storm Prediction Center document "About the Storm Prediction Center".
 - ^ a b c d e f g h i Novy, Chris; Roger Edwards, David Imy, Stephen Goss (2008-11-13). "Convective Outlooks". Storm Prediction Center and its Products. Storm Prediction Center. http://www.spc.noaa.gov/misc/about.html#Convective%20Outlooks. Retrieved 2009-12-27.
- ^ a b c d e f g Storm Prediction Center (2006-02-14). "Storm Prediction Center Day 1, 2 and 3 Convective Outlooks". National Weather Service. http://www.spc.noaa.gov/misc/SPC_Prob_Conv_Otlk_Change_20060214.html. Retrieved 2010-01-31.
- ^ National Weather Service (2009-06-25). "Public Severe Weather Outlook". Glossary — National Oceanic and Atmospheric Administration's National Weather Service. National Weather Service. http://www.nws.noaa.gov/glossary/index.php?word=Public+Severe+Weather+Outlook. Retrieved 2010-01-31.
- ^ http://www.crh.noaa.gov/news/display_cmsstory.php?wfo=lot&storyid=66428&source=0
- ^ a b c d Novy, Chris; Roger Edwards, David Imy, Stephen Goss (2008-11-13). "Mesoscale Discussions". Storm Prediction Center and its Products. Storm Prediction Center. http://www.spc.noaa.gov/misc/about.html#Convective%20Outlooks. Retrieved 2009-12-27.
- ^ a b Kerr, Brynn (2007-05-04). "Storm Prediction Center Mesoscale Discussion 685". Mesoscale Discussion 685. Storm Prediction Center. http://www.spc.noaa.gov/products/md/2007/md0685.html. Retrieved 2009-12-27.
- ^ a b c d e Novy, Chris; Roger Edwards, David Imy, Stephen Goss (2008-11-13). "Severe Weather Watches". Storm Prediction Center and its Products. Storm Prediction Center. http://www.spc.noaa.gov/misc/about.html#Convective%20Outlooks. Retrieved 2009-12-27.
- ^ a b c National Weather Service (2009-06-25). "PDS". Glossary — National Oceanic and Atmospheric Administration's National Weather Service. National Weather Service. http://www.nws.noaa.gov/glossary/index.php?word=PDS. Retrieved 2009-12-27.
- ^ a b Hales, Jack (2007-05-05). "Storm Prediction Center PDS Tornado Watch 232". PDS Tornado Watch 232. Storm Prediction Center. http://www.spc.noaa.gov/products/watch/2007/ww0232.html. Retrieved 2009-12-27.
- ^ a b c Novy, Chris; Roger Edwards, David Imy, Stephen Goss (2010-03-25). "Fire Weather Outlooks". Storm Prediction Center and its Products. Storm Prediction Center. http://www.spc.noaa.gov/misc/about.html#Convective%20Outlooks. Retrieved 2010-04-16.
- ^ a b This article incorporates public domain material from the Storm Prediction Center document "Fire weather outlooks".
External links
Coordinates: 35°10′53″N 97°26′25″W / 35.18139°N 97.44028°W
Categories:- National Weather Service
- Norman, Oklahoma
- History of Kansas City, Missouri
- National Centers for Environmental Prediction


Wikimedia Foundation. 2010.