- National debt by U.S. presidential terms
-
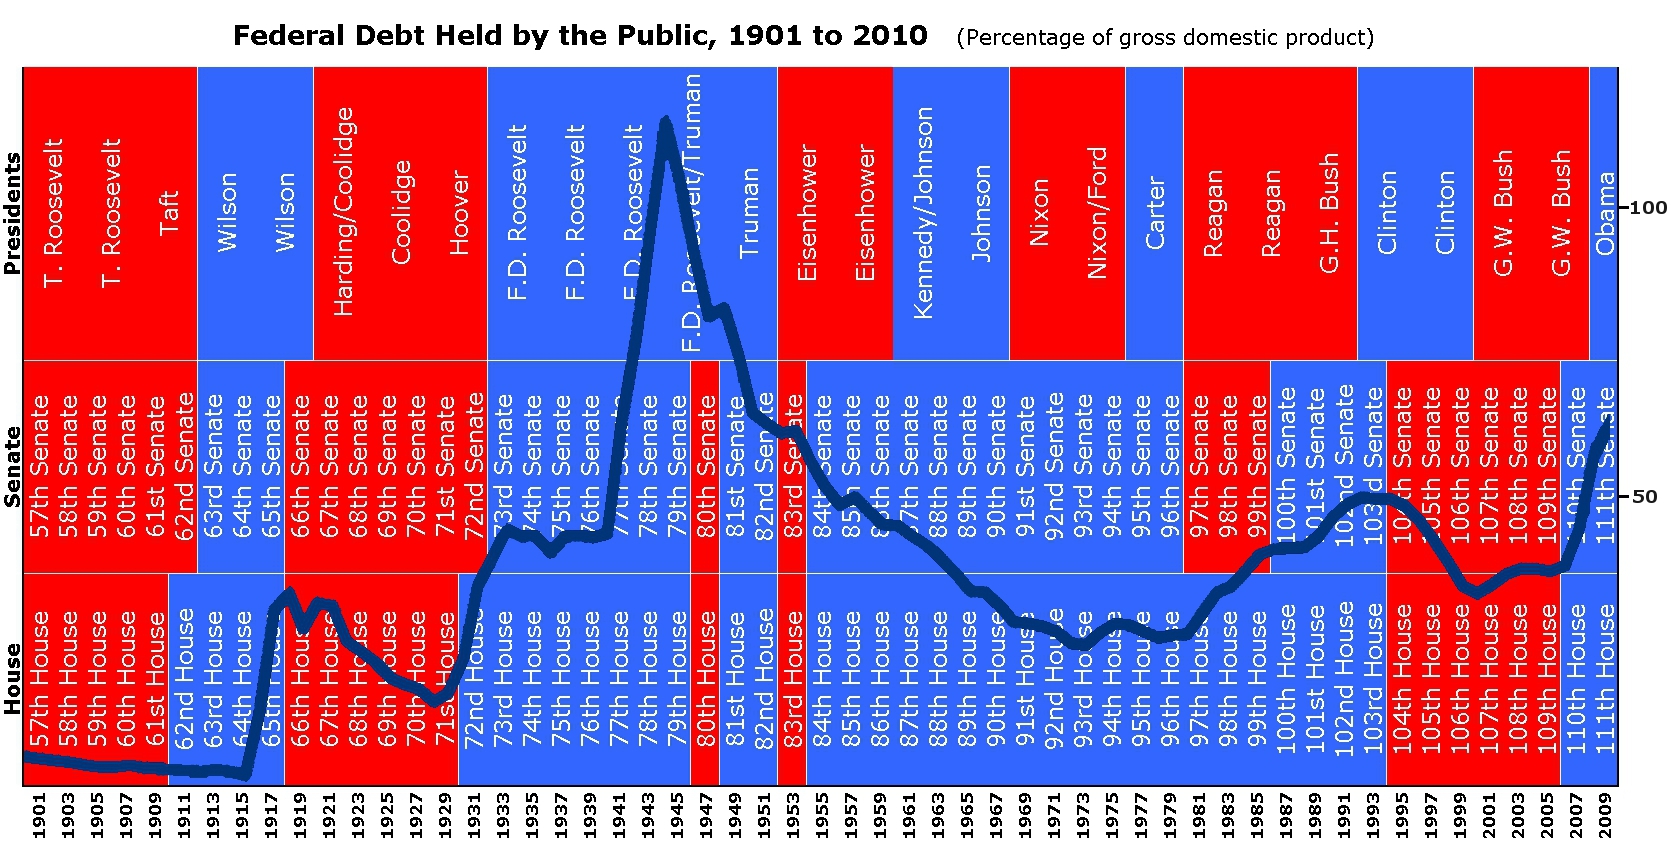
In the United States, national debt is money borrowed by the federal government of the United States. Debt burden is usually measured as a ratio of public debt to gross domestic product; the U.S. debt/GDP ratio reached a maximum during World War II near the beginning of President Harry Truman's first presidential term.
The President proposes the budget for the government to the US Congress. Congress may change the budget, but it rarely appropriates more than what the President requests.[1]
Contents
Commentary
Economist Mike Kimel notes that the five former Democratic Presidents (Bill Clinton, Jimmy Carter, Lyndon B. Johnson, John F. Kennedy, and Harry S. Truman) all reduced public debt as a share of GDP, while the last four Republican Presidents (George W. Bush, George H. W. Bush, Ronald Reagan, and Gerald Ford) all oversaw an increase in the country’s indebtedness.[2] Economic historian J. Bradford DeLong, former Clinton Treasury Department official, observes a contrast not so much between Republicans and Democrats, but between Democrats and "old-style Republicans (Eisenhower and Nixon)" on one hand (decreasing debt), and "new-style Republicans" on the other (increasing debt).[3][4] David Stockman, director of the Office of Management and Budget under President Ronald Reagan, as op-ed contributor to the New York Times, blamed the "ideological tax-cutters" of the Reagan administration for the increase of national debt during the 1980s.[5]
CNN's Jack Cafferty and CBS's Mark Knoller have noted that the US national debt in nominal dollars has increased more rapidly under President Obama than under any other U.S. president, and that it had increased by $4 trillion since the beginning of his term of office.[6][7]
Gross federal debt
This table lists the gross U.S. federal debt[8] as a percentage of GDP by Presidential term since World War II.[9] The current gross federal debt as a percentage of GDP (83.4% at the end of 2009) is currently the highest it has been since the late 1940s. The debt briefly reached over 100% of GDP in the aftermath of World War II.
The President proposes the budget for the government to the congress, which can amend it before passing. The U. S. Constitution in Article 1, Section 7 grants exclusive right to originate revenue related bills to the House of Representatives; the President's proposals are an indication of spending desired, but it is the House which defines the spending through the final wording of the bills. Since the budget resolution is a “concurrent” congressional resolution, not an ordinary bill, it does not go to the President for his signature or veto.[10] While this leaves substantial room for the legislature to change the deficit, congressional historian Louis Fisher observes that, "Congress rarely appropriates more than what the President requests." In the case of Nixon, who fought fiercely with Congress over the budget, he writes, "Congress was able to adhere to the President's totals while significantly altering his priorities." [11]
U.S. president Party Years Start debt/GDP End debt/GDP Increase debt
(in Billions of $)Increase debt/GDP
(in percentage points)House Control
(with # if
split during term)Senate Control
(with # if
split during term)Roosevelt D 1941–1945 50.4% 117.5% +203 +67.1% D D Roosevelt/Truman D 1945–1949 117.5% 93.1% -8 -24.4% 79th D, 80th R 79th D, 80th R Harry Truman D 1949–1953 93.1% 71.4% +13 -21.7% D D Dwight Eisenhower R 1953–1957 71.4% 60.4% +6 -11.0% 83rd R, 84th D 83rd R, 84th D Dwight Eisenhower R 1957–1961 60.4% 55.2% +20 -5.2% D D Kennedy/Johnson D 1961–1965 55.2% 46.9% +30 -8.3% D D Lyndon Johnson D 1965–1969 46.9% 38.6% +43 -8.3% D D Richard Nixon R 1969–1973 38.6% 35.6% +101 -3.0% D D Nixon/Ford R 1973–1977 35.6% 35.8% +177 +0.2% D D Jimmy Carter D 1977–1981 35.8% 32.5% +288 -3.3% D D Ronald Reagan R 1981–1985 32.5% 43.8% +823 +11.3% D R Ronald Reagan R 1985–1989 43.8% 53.1% +1,050 +9.3% D 99th R, 100th D George H. W. Bush R 1989–1993 53.1% 66.1% +1,483 +13.0% D D Bill Clinton D 1993–1997 66.1% 65.4% +1,018 -0.7% 103rd D, 104th R 103rd D, 104th R Bill Clinton D 1997–2001 65.4% 56.4% +401 -9.0% R R George W. Bush R 2001–2005 56.4% 63.5% +2,135 +7.1% R 107th Split, 108 R George W. Bush R 2005–2009 63.5% 84.2% +4,521 +20.7% 109th R, 110th D 109th R, 110th D Barack Obama D 2009–2011 84.2% 99.6% +4,334 +15.4% 111th D, 112th R D (Source: CBO Historical Budget Page and Whitehouse FY 2012 Budget - Table 7.1 Federal Debt at the End of Year PDF, Excel, Senate.gov)
Notes:
- For net jobs changes over the corresponding periods, see: Jobs created during U.S. presidential terms.
Public debt
 Time series of U.S. public debt overlaid with partisan affiliation of the White House. The upper graph shows the U.S. public debt in trillions of USD while the lower graph shows the U.S. public debt as a percentage of GDP. (Data are from the 2009 U.S. Budget.)
Gross debt and public debt are different. Public debt is the gross debt minus intra-governmental obligations (such as the money that the government owes to the two Social Security Trust Funds, the Old-Age, Survivors, and Disability Insurance program, and the Social Security Disability Insurance program).[12]
The figures show the trend in public debt with the background colored by the party controlling the executive and legislative branches of government. The color of the trend line does not represent party affiliation; only the background color does.
 Time series of U.S. federal debt overlaid with partisan affiliation of the White House and the Congress.
Federal spending, federal debt, and GDP
The table below shows the annual federal spending, gross federal debt, and gross domestic product for average presidential parties, specific presidential terms, and specific fiscal years.[13] The Table Below is for Fiscal Years not Presidential Terms. For instance, President Bush left office and responsibility of legislation signed on January 20, 2009. However this table shows legislation signed by President Obama under President Bush for January 20, 2009 to September 30, 2009, the end of the 2008 Fiscal Year.
Fiscal Year President Party of President Federal Spending Federal Debt Gross Domestic Product Inflation Adjustor[14] Billions[15] Adjusted[16] Increase Billions[17] Adjusted[18] Percentage Increase Billions[19] Adjusted[20] Increase Yearly Average
1978-2009Democratic 2.4% 1.0% 3.0% Yearly Average
1978-2009Republican 3.0% 7.3% 2.5% 1978–1981 Carter Democratic $678 $1,219 17.2% $994 $1,787 -0.4% $3,055 $5,492 9.4% 1982–1985 Reagan Republican $946 $1,396 14.5% $1,817 $2,680 49.0% $4,142 $6,108 11.2% 1986–1989 Reagan Republican $1,144 $1,499 7.4% $2,867 $3,757 40.2% $5,401 $7,077 15.9% 1990–1993 Bush Republican $1,410 $1,615 7.8% $4,351 $4,987 32.7% $6,576 $7,536 6.5% 1994–1997 Clinton Democratic $1,601 $1,684 4.3% $5,369 $5,647 13.2% $8,182 $8,606 14.2% 1998–2001 Clinton Democratic $1,863 $1,821 8.1% $5,769 $5,638 -0.2% $10,058 $9,829 14.2% 2002–2005 Bush Republican $2,472 $2,165 18.9% $7,905 $6,923 22.8% $12,238 $10,717 9.0% 2006-2009* Bush Republican $3,107 $2,452 13.3% $10,413 $8,218 18.7% $15,027 $11,859 10.7% 1977 Ford Republican $409 $1,040 $706 $1,795 $1,974 $5,019 0.39 1978 Carter Democratic $459 $1,093 5.1% $776 $1,850 3.1% $2,217 $5,285 5.3% 0.42 1979 Carter Democratic $504 $1,107 1.3% $829 $1,821 -1.5% $2,501 $5,494 4.0% 0.46 1980 Carter Democratic $591 $1,175 6.1% $909 $1,808 -0.8% $2,727 $5,422 -1.3% 0.50 1981 Carter Democratic $678 $1,219 3.8% $994 $1,787 -1.1% $3,055 $5,492 1.3% 0.56 1982 Reagan Republican $746 $1,252 2.6% $1,137 $1,908 6.8% $3,228 $5,417 -1.4% 0.60 1983 Reagan Republican $808 $1,294 3.4% $1,371 $2,195 15.0% $3,441 $5,510 1.7% 0.62 1984 Reagan Republican $852 $1,300 0.4% $1,564 $2,386 8.7% $3,840 $5,858 6.3% 0.66 1985 Reagan Republican $946 $1,396 7.4% $1,817 $2,680 12.3% $4,142 $6,108 4.3% 0.68 1986 Reagan Republican $990 $1,426 2.1% $2,120 $3,052 13.9% $4,412 $6,352 4.0% 0.69 1987 Reagan Republican $1,004 $1,406 -1.4% $2,345 $3,283 7.6% $4,647 $6,506 2.4% 0.71 1988 Reagan Republican $1,065 $1,447 2.9% $2,601 $3,534 7.7% $5,009 $6,806 4.6% 0.74 1989 Reagan Republican $1,144 $1,499 3.6% $2,867 $3,757 6.3% $5,401 $7,077 4.0% 0.76 1990 Bush Republican $1,253 $1,590 6.1% $3,206 $4,067 8.3% $5,735 $7,277 2.8% 0.79 1991 Bush Republican $1,324 $1,610 1.3% $3,598 $4,374 7.5% $5,935 $7,215 -0.8% 0.82 1992 Bush Republican $1,382 $1,624 0.9% $4,001 $4,703 7.5% $6,240 $7,334 1.7% 0.85 1993 Bush Republican $1,410 $1,615 -0.5% $4,351 $4,987 6.0% $6,576 $7,536 2.8% 0.87 1994 Clinton Democratic $1,462 $1,642 1.7% $4,643 $5,216 4.6% $6,961 $7,820 3.8% 0.89 1995 Clinton Democratic $1,516 $1,662 1.2% $4,920 $5,395 3.4% $7,326 $8,033 2.7% 0.91 1996 Clinton Democratic $1,561 $1,673 0.7% $5,181 $5,554 3.0% $7,694 $8,248 2.7% 0.93 1997 Clinton Democratic $1,601 $1,684 0.7% $5,369 $5,647 1.7% $8,182 $8,606 4.3% 0.95 1998 Clinton Democratic $1,653 $1,721 2.2% $5,478 $5,704 1.0% $8,628 $8,985 4.4% 0.96 1999 Clinton Democratic $1,702 $1,746 1.5% $5,605 $5,750 0.8% $9,125 $9,361 4.2% 0.97 2000 Clinton Democratic $1,789 $1,789 2.5% $5,628 $5,628 -2.1% $9,710 $9,710 3.7% 1.00 2001 Clinton Democratic $1,863 $1,821 1.8% $5,769 $5,638 0.2% $10,058 $9,829 1.2% 1.02 2002 Bush Republican $2,011 $1,929 6.0% $6,198 $5,945 5.5% $10,377 $9,954 1.3% 1.04 2003 Bush Republican $2,160 $2,018 4.6% $6,760 $6,316 6.2% $10,809 $10,099 1.4% 1.07 2004 Bush Republican $2,293 $2,082 3.2% $7,354 $6,677 5.7% $11,500 $10,441 3.4% 1.10 2005 Bush Republican $2,472 $2,165 4.0% $7,905 $6,923 3.7% $12,238 $10,717 2.6% 1.14 2006 Bush Republican $2,655 $2,249 3.9% $8,451 $7,158 3.4% $13,016 $11,024 2.9% 1.18 2007 Bush Republican $2,730 $2,263 0.6% $8,951 $7,419 3.6% $13,668 $11,329 2.8% 1.21 2008 Bush Republican $2,931 $2,366 4.6% $9,654 $7,793 5.0% $14,312 $11,553 0% 1.24 2009* Bush Republican $3,107 $2,452 3.6% $10,413 $8,218 5.5% $14,097 $11,529 2.6% 1.27 2010* Obama Democratic $3,091 $2,392 -2.4% $11,875 $9,247 12.5% $14,508 $11,297 -2.0% 1.29 Notes
- The government fiscal year runs from October 1 (of the previous calendar year) to September 30. Budgets are enacted before the November general elections. This is why FY2001 falls under Clinton and FY2009 falls under G.W. Bush, they started in October 1, 2000 and October 1, 2008, respectively.
- The dollar amounts for each presidential term are taken from the last fiscal year in that term.
- The increase in each presidential term is the increase in the adjusted amount from the last fiscal year of the previous term to the last fiscal year of the current term.
- The value for each presidential party is the average of the values for all the presidents in that party.
- The values for the years 2009, and 2010 represent estimates from the source material.
See also
Notes
- ^ Fisher, Louis (Nov. - Dec. 1990). "Federal Budget Doldrums: The Vacuum in Presidential Leadership". Public Administration Review 50 (6): 693–700. doi:10.2307/976984. JSTOR 976984.
- ^ Kimel, Mike (2007-12-04). "The Republican Party and the National Debt". angrybearblog.com. http://www.angrybearblog.com/2007/12/republican-party-and-national-debt.html. Retrieved 15 April 2011.
- ^ Brad DeLong (2009-11-20). "Comparing Debt-to-GDP Ratios with Presidential Terms". Seeking Alpha. http://seekingalpha.com/article/174445-comparing-debt-to-gdp-ratios-with-presidential-terms. Retrieved 2010-08-09. "contrast between the Democrats and the old-style Republicans (Eisenhower and Nixon) on the one hand and the new-style Republicans on the other is quite striking."
- ^ Brad DeLong (2008-05-01). "Short-Term Costs of Long-Run Fiscal Stupidity - Grasping Reality with Both Hands". Delong.typepad.com. http://delong.typepad.com/sdj/2008/05/short-term-cost.html. Retrieved 2010-08-09.
- ^ Stockman, David (2010-07-31). "Four Deformations of the Apocalypse". New York Times (nytimes.com). http://www.nytimes.com/2010/08/01/opinion/01stockman.html?_r=1. Retrieved 2010-08-09.
- ^ "National debt has increased $4 trillion under Obama". CBS News. 22 August 2011. http://www.cbsnews.com/8301-503544_162-20095704-503544.html. Retrieved 25 August 2011.
- ^ "Tea Party effect on 2012 elections?". CNN. 23 August 2011. http://caffertyfile.blogs.cnn.com/2011/08/23/tea-party-effect-on-2012-elections/. Retrieved 25 August 2011.
- ^ The gross federal debt includes intra-government debt, i.e. money owed by one branch of the federal government to another. When this amount is subtracted the remaining quantity is known as the public debt.
- ^ Budget FY2007
- ^ http://www.cbpp.org/cms/?fa=view&id=155
- ^ Fisher, Louis (Nov. - Dec. 1990). "Federal Budget Doldrums: The Vacuum in Presidential Leadership". Public Administration Review 50 (6): 693–700. doi:10.2307/976984. JSTOR 976984.
- ^ Frontline - Ten Trillion and Counting: Defining the Debt
- ^ Budget FY 2009
- ^ Budget FY2009. Addendum: Composite Deflator, page 26. Divide current dollars by this number to produce value in (constant) FY2000 dollars.
- ^ Budget FY2009. Outlays in current dollars, page 26.
- ^ Budget FY2009. Outlays in current dollars, page 26, divided by Inflation Adjustor.
- ^ Budget FY 2009. Gross Federal Debt in current dollars, page 127.
- ^ Budget FY 2009. Gross Federal Debt in current dollars, page 127, divided by Inflation Adjustor.
- ^ Budget FY2009. GDP (Gross Domestic Product) in current dollars, page 194.
- ^ Budget FY2009. GDP (Gross Domestic Product) in current dollars, page 194, divided by Inflation Adjustor.
References
- Budget of the United States Government, Fiscal Year 2007.
- Budget of the United States Government, Fiscal Year 2009.
- Budget of the United States Government, Fiscal Year 2012.
External links
- Another tabulation of Federal deficits (not debt) by Presidential term
- Another tabulation of Federal debt (not deficit) by Presidential term since 1976: per capita, per capita income, and as percentage of GDP
- Stephen Bloch. "U.S. Federal Deficits and Presidents". home.adelphi.edu. http://home.adelphi.edu/sbloch/deficits.html. Retrieved 9 August 2010.
- Brad DeLong (2009-11-20). "Comparing Debt-to-GDP Ratios with Presidential Terms". Seeking Alpha. http://seekingalpha.com/article/174445-comparing-debt-to-gdp-ratios-with-presidential-terms. Retrieved 2010-08-09.
- Brad DeLong (2008-05-01). "Short-Term Costs of Long-Run Fiscal Stupidity - Grasping Reality with Both Hands". Delong.typepad.com. http://delong.typepad.com/sdj/2008/05/short-term-cost.html. Retrieved 2010-08-09.
- Scott Willeke (2010-03-02). "United States Deficit & Debt During Presidents from 1969-2019". Blog.scott.willeke.com. http://blog.scott.willeke.com/2010/03/united-states-deficit-debt-during.html. Retrieved 2010-08-09.
- Steve Stoft. "U.S. National Debt Graph: What the Press Won't Tell You". Zfacts.com. http://zfacts.com/p/318.html. Retrieved 2010-08-09.</ref>
Categories:- Economy of the United States
- United States public debt
- Government finances in the United States
- United States presidential administrations

Wikimedia Foundation. 2010.