- Color histogram
-
Not to be confused with Image histogram.
In image processing and photography, a color histogram is a representation of the distribution of colors in an image. For digital images, a color histogram represents the number of pixels that have colors in each of a fixed list of color ranges, that span the image's color space, the set of all possible colors.
The color histogram can be built for any kind of color space, although the term is more often used for three-dimensional spaces like RGB or HSV. For monochromatic images, the term intensity histogram may be used instead. For multi-spectral images, where each pixel is represented by an arbitrary number of measurements (for example, beyond the three measurements in RGB), the color histogram is N-dimensional, with N being the number of measurements taken. Each measurement has its own wavelength range of the light spectrum, some of which may be outside the visible spectrum.
If the set of possible color values is sufficiently small, each of those colors may be placed on a range by itself; then the histogram is merely the count of pixels that have each possible color. Most often, the space is divided into an appropriate number of ranges, often arranged as a regular grid, each containing many similar color values. The color histogram may also be represented and displayed as a smooth function defined over the color space that approximates the pixel counts.
Like other kinds of histograms, the color histogram is a statistic that can be viewed as an approximation of an underlying continuous distribution of colors values.
Contents
Overview
Color histograms are flexible constructs that can be built from images in various color spaces, whether RGB, rg chromaticity or any other color space of any dimension. A histogram of an image is produced first by discretization of the colors in the image into a number of bins, and counting the number of image pixels in each bin. For example, a Red–Blue chromaticity histogram can be formed by first normalizing color pixel values by dividing RGB values by R+G+B, then quantizing the normalized R and B coordinates into N bins each. A two-dimensional histogram of Red-Blue chromaticity divide in to four bins (N=4) might yield a histogram that looks like this table:
red 0-63 64-127 128-191 192-255 blue 0-63 43 78 18 0 64-127 45 67 33 2 128-191 127 58 25 8 192-255 140 47 47 13 A histogram can be N-dimensional. Although harder to display, a three-dimensional color histogram for the above example could be thought of as four separate Red-Blue histograms, where each of the four histograms contains the Red-Blue values for a bin of green (0-63, 64-127, 128-191, and 192-255).
The histogram provides a compact summarization of the distribution of data in an image. The color histogram of an image is relatively invariant with translation and rotation about the viewing axis, and varies only slowly with the angle of view.[1] By comparing histograms signatures of two images and matching the color content of one image with the other, the color histogram is particularly well suited for the problem of recognizing an object of unknown position and rotation within a scene. Importantly, translation of an RGB image into the illumination invariant rg-chromaticity space allows the histogram to operate well in varying light levels.
Example Histogram Data
Given the following image of a cat (an original version and a version that has been reduced to 256 colors for easy histogram purposes), the following data represents a color histogram in the RGB color space, using four bins. Bin 0 corresponds to intensities 0-63, bin 1 is 64-127, bin 2 is 128-191, and bin 3 is 192-255.
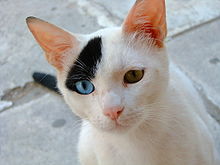 A picture of a cat
 A picture of a cat reduced to 256 colors in the RGB color space
Red Green Blue Pixel Count 0 0 0 7414 0 0 1 230 0 0 2 0 0 0 3 0 0 1 0 8 0 1 1 372 0 1 2 88 0 1 3 0 0 2 0 0 0 2 1 0 0 2 2 10 0 2 3 1 0 3 0 0 0 3 1 0 0 3 2 0 0 3 3 0 1 0 0 891 1 0 1 13 1 0 2 0 1 0 3 0 1 1 0 592 1 1 1 3462 1 1 2 355 1 1 3 0 1 2 0 0 1 2 1 101 1 2 2 882 1 2 3 16 1 3 0 0 1 3 1 0 1 3 2 0 1 3 3 0 2 0 0 1146 2 0 1 0 2 0 2 0 2 0 3 0 2 1 0 2552 2 1 1 9040 2 1 2 47 2 1 3 0 2 2 0 0 2 2 1 8808 2 2 2 53110 2 2 3 11053 2 3 0 0 2 3 1 0 2 3 2 170 2 3 3 17533 3 0 0 11 3 0 1 0 3 0 2 0 3 0 3 0 3 1 0 856 3 1 1 1376 3 1 2 0 3 1 3 0 3 2 0 0 3 2 1 3650 3 2 2 6260 3 2 3 109 3 3 0 0 3 3 1 0 3 3 2 3415 3 3 3 53929 Drawbacks and other approaches
The main drawback of histograms for classification is that the representation is dependent of the color of the object being studied, ignoring its shape and texture. Color histograms can potentially be identical for two images with different object content which happens to share color information. Conversely, without spatial or shape information, similar objects of different color may be indistinguishable based solely on color histogram comparisons. There is no way to distinguish a red and white cup from a red and white plate. Put another way, histogram-based algorithms have no concept of a generic 'cup', and a model of a red and white cup is no use when given an otherwise identical blue and white cup. Another problem is that color histograms have high sensitivity to noisy interference such as lighting intensity changes and quantization errors. High dimensionality (bins) color histograms are also another issue. Some color histogram feature spaces often occupy more than one hundred dimensions.[2]
Some of the proposed solutions have been color histogram intersection, color constant indexing, cumulative color histogram, quadratic distance, and color correlograms. Although there are drawbacks of using histograms for indexing and classification, using color in a real-time system has several advantages. One is that color information is faster to compute compared to other invariants. It has been shown in some cases that color can be an efficient method for identifying objects of known location and appearance.
Further research into the relationship between color histogram data to the physical properties of the objects in an image has shown they can represent not only object color and illumination but relate to surface roughness and image geometry and provide an improved estimate of illumination and object color.[3]
Usually, Euclidean distance, histogram intersection, or cosine or quadratic distances are used for the calculation of image similarity ratings.[4] Any of these values do not reflect the similarity rate of two images in itself; it is useful only when used in comparison to other similar values. This is the reason that all the practical implementations of content-based image retrieval must complete computation of all images from the database, and is the main disadvantage of these implementations.
Another approach to representative color image content is two-dimensional color histogram. A two-dimensional color histogram considers the relation between the pixel pair colors (not only the lighting component).[5] A two-dimensional color histogram is a two-dimensional array. The size of each dimension is the number of colors that were used in the phase of color quantization. These arrays are treated as matrices, each element of which stores a normalized count of pixel pairs, with each color corresponding to the index of an element in each pixel neighborhood. For comparison of two-dimensional color histograms it is suggested calculating their correlation, because constructed as described above, is a random vector (in other words, a multi-dimensional random value). While creating a set of final images, the images should be arranged in decreasing order of the correlation coefficient.
The correlation coefficient may also be used for color histogram comparison. Retrieval results with correlation coefficient are better than with other metrics.[6]
Intensity histogram of continuous data
The idea of an intensity histogram can be generalized to continuous data, say audio signals represented by real functions or images represented by functions with two-dimensional domain.
Let
 (see Lebesgue space), then the cumulative histogram operator H can be defined by:
 .
.
μ is the Lebesgue measure of sets. H(f) in turn is a real function. The (non-cumulative) histogram is defined as its derivative.
- h(f) = H(f)'.
References
- ^ Shapiro, Linda G. and Stockman, George C. "Computer Vision" Prentice Hall, 2003 ISBN 0130307963
- ^ Xiang-Yang Wang, Jun-Feng Wu1 and Hong-Ying Yang "Robust image retrieval based on color histogram of local feature regions" Springer Netherlands, 2009 ISSN 1573-7721
- ^ Anatomy of a color histogram; Novak, C.L.; Shafer, S.A.; Computer Vision and Pattern Recognition, 1992. Proceedings CVPR '92., 1992 IEEE Computer Society Conference on 15–18 June 1992 Page(s):599 - 605 doi:10.1109/CVPR.1992.223129
- ^ Integrated Spatial and Feature Image Systems: Retrieval, Analysis and Compression; Smith, J.R.; Graduate School of Arts and Sciences, Columbia University, 1997
- ^ Effectiveness estimation of image retrieval by 2D color histogram; Bashkov, E.A.; Kostyukova, N.S.; Jornal of Automation and Information Sciences, 2006 (6) Page(s): 84-89
- ^ Content-Based Image Retrieval Using Color Histogram Correlation; Bashkov, E.A.; Shozda, N.S.; Graphicon proceedings, 2002 Page(s): 458-461 [1]
External links
- 3D Color Inspector/Color Histogram, by Kai Uwe Barthel. (Free Java applet.)
- QBIC Image Retrieval, by State Hermitage Museum
- Stanford Student Project on Image Based Retrieval - more in depth look at equations/application
- MATLAB/Octave code for plotting Color Histograms and Color Clouds - The source code can be ported to other languages
Categories:

Wikimedia Foundation. 2010.