Mathematical visualization
- Mathematical visualization
-

The
Mandelbrot set, one of the most famous examples of mathematical visualization.
Mathematical visualization is an aspect of geometry which allows one to understand and explore mathematical phenomena via visualization. Classically this consisted of two-dimensional drawings or building three-dimensional models (particularly plaster models in the 19th and early 20th century), while today it most frequently consists of using computers to make static two or three dimensional drawings, animations, or interactive programs. Writing programs to visualize mathematics is an aspect of computational geometry.
Applications
Mathematical visualization is used throughout mathematics, particularly in the fields of geometry and analysis. Notable examples include plane curves, space curves, polyhedra, ordinary differential equations, partial differential equations (particularly numerical solutions, as in fluid dynamics or minimal surfaces such as soap films), conformal maps, fractals, and chaos.
Examples
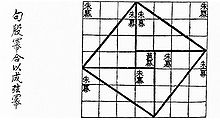
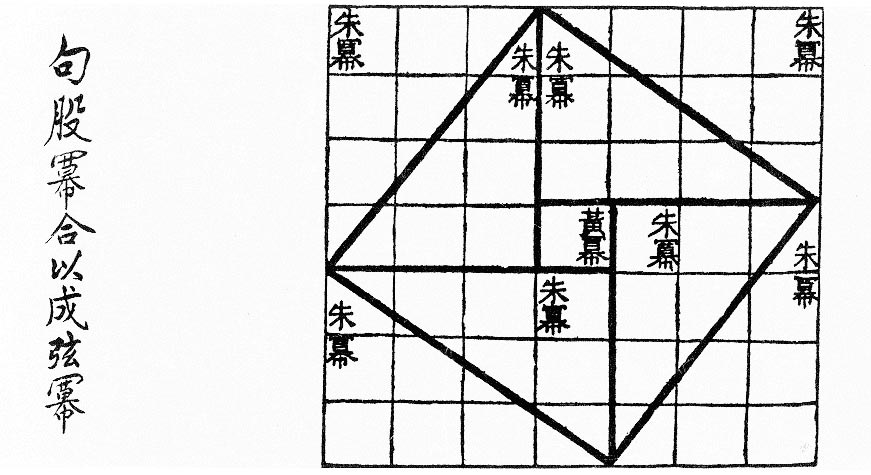
- Proofs without words have existed since antiquity, as in the Pythagorean theorem proof found in the Zhou Bi Suan Jing chinese text which dates from 1046 BC to 256 BC.
- The Clebsch diagonal surface demonstrates the 27 lines on a cubic surface.
A
Morin surface, the half-way stage in turning a sphere inside out.
- Sphere eversion – that a sphere can be turned inside out in 3 dimension if allowed to pass through itself, but without kinks – was a startling and counter-intuitive result, originally proven via abstract means, later demonstrated graphically, first in drawings, later in computer animation.
The cover of the journal The Notices of the American Mathematical Society regularly features a mathematical visualization.
Software
References
External links
Wikimedia Foundation.
2010.
Look at other dictionaries:
Mathematical diagram — This article is about general diagrams in mathematics. For diagrams in the category theoretical sense, see Diagram (category theory). Euclid s Elements, ms. from Lüneburg, A.D. 1200 Mathematical diagrams are diagrams in the field of mathematics,… … Wikipedia
Mathematical anxiety — is anxiety about one s ability to do mathematics independent of skill. Contents 1 Math anxiety 2 Performance anxiety 3 Anxiety Rating Scale 4 Math and c … Wikipedia
Mathematical notation — For information on rendering mathematical formulas in Wikipedia, see Help:Formula. See also: Table of mathematical symbols Mathematical notation is a system of symbolic representations of mathematical objects and ideas. Mathematical notations are … Wikipedia
Mathematical modelling of infectious disease — It is possible to mathematically model the progress of most infectious diseases to discover the likely outcome of an epidemic or to help manage them by vaccination. This article uses some basic assumptions and some simple mathematics to find… … Wikipedia
Mathematical proof — In mathematics, a proof is a convincing demonstration (within the accepted standards of the field) that some mathematical statement is necessarily true.[1][2] Proofs are obtained from deductive reasoning, rather than from inductive or empirical… … Wikipedia
Scientific visualization — A scientific visualization of an extremely large simulation of a Rayleigh–Taylor instability caused by two mixing fluids.[1] Scientific visualization (also spelled scientific visualisation) is an interdisciplinary branch of science according to… … Wikipedia
Data visualization — A data visualization of Wikipedia as part of the World Wide Web, demonstrating hyperlinks Data visualization is the study of the visual representation of data, meaning information that has been abstracted in some schematic form, including… … Wikipedia
Information visualization — the interdisciplinary study of the visual representation of large scale collections of non numerical information, such as files and lines of code in software systems [S.G. Eick (1994). Graphically displaying text . In: Journal of Computational… … Wikipedia
Courant Institute of Mathematical Sciences — (CIMS) Established 1935 Type Private Academic staff 82 … Wikipedia
Ferret Data Visualization and Analysis — Ferret is an interactive computer visualization and analysis environment designed to meet the needs of oceanographers and meteorologists analyzing large and complex gridded data sets. Ferret offers a Mathematica like approach to analysis; new… … Wikipedia