- Central Karoo District Municipality
Zamuni
code=DC5
location=Western Cape 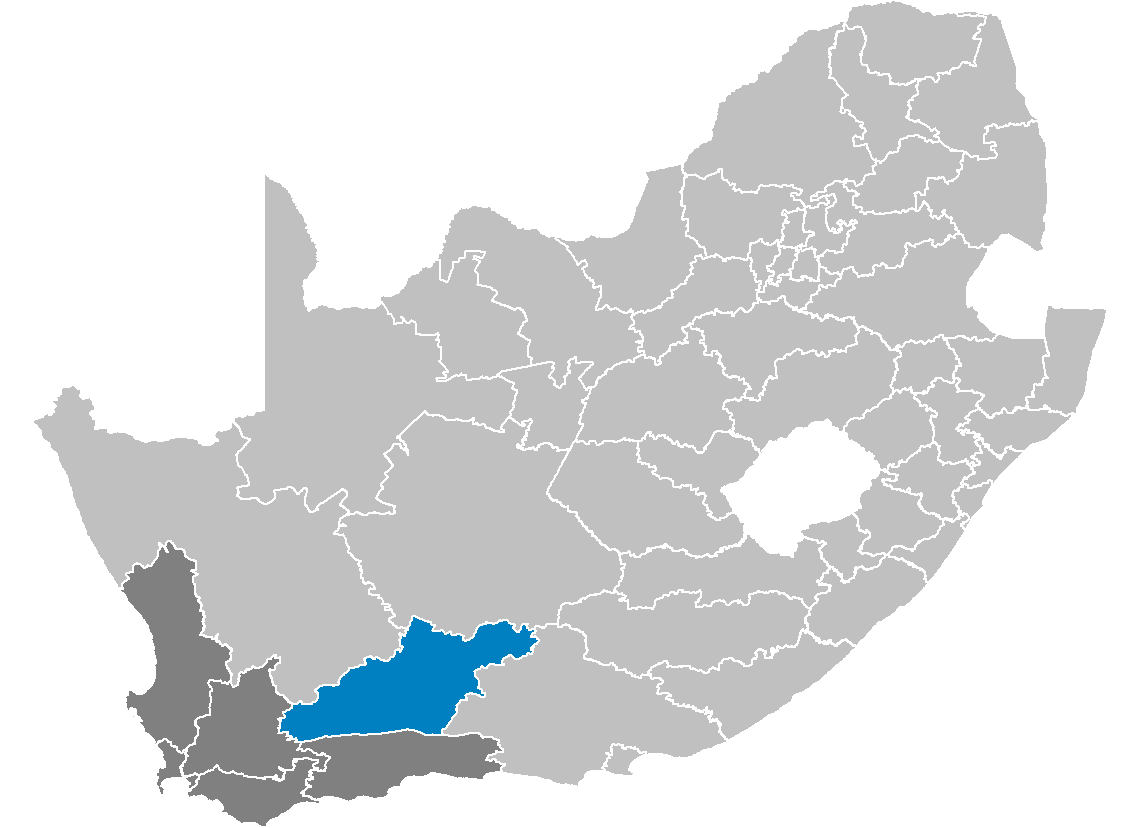
area=38853
seat=Beaufort West
neighbours=Karoo (north), Cacadu (east), Eden (south), Cape Winelands (west), Namakwa (northwest)
mayor=Doreen Hugo (ANC)
population=57321
population density=1.4753
habitations=15160
habitation density=0.39019
races=75.30%Coloured , 17.40% Black, 7.30% White
languages=91.0% Afrikaans, 5.2% Xhosa, 2.0% English
website=noneThe Central Karoo District Municipality is a district municipality located in the
Western Cape Province ofSouth Africa . Its municipality code is DC5.Geography
Adjacent municipalities
*
Karoo District Municipality ,Northern Cape (north)
*Cacadu District Municipality ,Eastern Cape (east)
*Eden District Municipality (south)
*Cape Winelands District Municipality (west)
*Namakwa District Municipality ,Northern Cape (northwest)Local municipalities
*
Laingsburg Local Municipality (WC051)
*Prince Albert Local Municipality (WC052)
*Beaufort West Local Municipality (WC053)
*ADistrict Management Area , area 5,585 km², which has no local municipality (WCDMA05) - see belowDistrict Management Area
Part of the Central Karoo DM is a
District Management Area (DMA), municipality code WCDMA05, which has no local municipality.Demographics of the DMA
As of the
census of2001 , there are 6,184 people and 1,543 households residing in the District Management Area. Thepopulation density is 1.11/km². The density of households is 0.28/km². The racial makeup of the DMA is Black African 17.40,Coloured 75.31%,India n/Asia n 0.00%, White 7.29%.17.1% of all households are made up of individuals. The average household size is 4.01.
In the DMA the population is spread out with 36.8% under the age of 15, 15.2% from 15 to 24, 26.5% from 25 to 44, 15.7% from 45 to 64, and 5.9% who are 65 years of age or older. The median age is 23 years. For every 100 females there are 94.4 males. For every 100 females age 18 and over, there are 89.1 males.
In the DMA 91.0% of residents speak
Afrikaans at home, 2.0% speak English, 0.0% speak Ndebele, 5.2% speak Xhosa, 0.0% speak Zulu, 0.0% speak Northern Sotho, 0.3% speak Sotho, 0.0% speak Tswana, 0.0% speak Swati, 0.0% speak Venda, and 0.0% speak Tsonga. 1.4% of the population speaks a non-official language at home.96.4% of residents are Christian, 2.2% have no religion, 0.0% are Muslim, 0.0% are Jewish, and 0.0% are Hindu. 1.4% have other or undetermined beliefs.
30.3% of residents aged 20 and over have received no schooling, 27.2% have had some
primary school , 8.6% have completed only primary school, 18.6% have had somehigh school education, 6.3% have finished only high school, and 9.0% have an education higher than the high school level. Overall, 15.3% of residents have completed high school.28.9% of housing units have a
telephone and/orcell-phone in the dwelling, 56.3% have access to a phone nearby, and 14.8% have access that is not nearby or no access. 79.3% of households have a flush or chemicaltoilet . 62.3% haverefuse removed by the municipality at least once a week and 0.5% have no rubbish disposal. 36.9% have running water inside their dwelling, 90.9% have running water on their property, and 98.3% have access to running water. 34.2% of households useelectricity for cooking, 23.2% for heating, and 84.4% for lighting. 71.3% of households have aradio , 48.8% have atelevision , 4.9% own acomputer , 43.1% have arefrigerator , and 16.4% have acell-phone .17.7% of the population aged 15-65 is unemployed. Of the unemployed persons, 22.9% are Black African, 75.0% are Coloured, 0.0% are Indian/Asian, and 1.9% are White. 23.4% of Black Africans are unemployed, 17.9% of Coloureds, 0.0% of Indians/Asians, and 4.0% of Whites.
The median annual income of working adults aged 15-65 is R 7 033 ($1,050). Males have a median annual income of R 7 761 ($1,159) versus R 4 362 ($652) for females. The median annual income by race is R 6 757 ($1,009) for Black Africans, R 6 211 ($928) for Coloureds, R 0 ($0) for Indians/Asians, and R 41 611 ($6,215) for Whites. The annual income distribution in the Central Karoo DMA is:
*No income 2.6%
*R 12 – R 4,800 ($2 - $717) 32.0%
*R 4,812 – R 9,600 ($719 - $1,434) 33.2%
*R 9,612 – R 19,200 ($1,436 – $2,868) 13.6%
*R 19,212 – R 38,400 ($2,870 - $5,736) 7.1%
*R 38,412 – R 76,800 ($5,738 - $11,471) 6.7%
*R 76,812 – R 153,600 ($11,473 - $22,942) 3.3%
*R 153,612 – R 307,200 ($22,944 - $45,885) 0.3%
*R 307,212 – R 614,400 ($45,887 - $91,770) 0.7%
*R 614,412 or more ($91,77+) 0.4%[http://www.statssa.gov.za/census01/Census/Database/Census%202001/Census%202001.asp Statistics South Africa Census 2001]
Politics
Election results
Election results for Central Karoo in the
South African general election, 2004 .
* Population 18 and over: 36 989 [61.17% of total population]
* Total votes: 23 829 [39.40% of total population]
* Voting % estimate: 64.42% votes as a % of population 18 and overExternal links
* [http://www.demarcation.org.za/ Municipal Demarcation Board]
* [http://www.statssa.gov.za/census01/html/default.asp Stats SA Census 2001 page]
* [http://www.elections.org.za/Elections2004_Static.asp Independent Electoral Commission 2004 election results]
* [http://www.capegateway.gov.za/eng/your_gov/12242 District site]
* [http://www.centralkaroo.co.za/ Tourismussite]
Wikimedia Foundation. 2010.