- Marlene Jennings
-
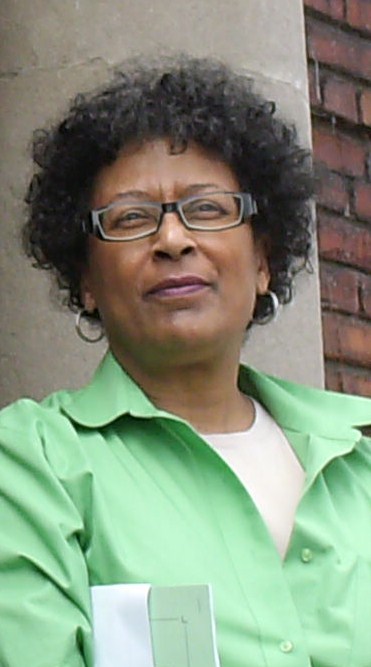
Hon. Marlene Jennings 
Member of Parliament
for Notre-Dame-de-Grâce—LachineIn office
1997–2011Preceded by Warren Allmand Succeeded by Isabelle Morin Personal details Born November 10, 1951
Longueuil, QuebecPolitical party Liberal Marlene Jennings, PC, MP (born November 10, 1951) is a Canadian politician. She was a member of the Liberal Party of Canada in the Canadian House of Commons, and represented the riding of Notre-Dame-de-Grâce—Lachine from 1997 to 2011.
Jennings was born in Longueuil, Quebec. She is a former lawyer and senior public servant. She is the former Parliamentary Secretary to the Minister for International Cooperation, the former Parliamentary Secretary to the Solicitor General of Canada, and a former Member of Parliament. From 2004 to October 2005, she was Parliamentary Secretary to the Prime Minister with special emphasis on Canada-U.S. relations.
Jennings was the first black woman from Quebec to be elected to Parliament in the history of Confederation. She is also one of the few parliamentarians with a physical disability, having become partially blind due to an illness in early 2011; she uses visual aids and a white cane.[1]
Electoral history
Jennings succeeded Warren Allmand, the popular MP for Notre-Dame-de-Grâce, in the reorganized riding of Notre-Dame-de-Grâce—Lachine upon its creation in 1997. She was elected five times in the riding with consistent margins of between 10,000 and 20,000 votes, and her riding was considered one of the safest Liberal seats in the country. However, she fell to Quebec's "orange wave" in the Canadian federal election, 2011, losing her seat to Isabelle Morin of the NDP.
Canadian federal election, 2011 Party Candidate Votes % ±% Expenditures New Democrat Isabelle Morin 17,943 39.73% +24.57% Liberal Marlene Jennings 14,407 31.90% -12.72% Conservative Matthew Conway 6,574 14.56% -1.66% Bloc Québécois Gabrielle Ladouceur-Despins 3,983 8.82% -7.07% Green Jessica Gal 1,914 4.24% -3.47% Independent David Andrew Lovett 207 0.46% Marxist–Leninist Rachel Hoffman 131 0.29% -0.11% Total valid votes 45,159 100.00% Total rejected ballots 464 1.02% +0.12% Turnout 45,623 Source: Elections Canada
Canadian federal election, 2008 Party Candidate Votes % ±% Expenditures Liberal Marlene Jennings 19,554 44.62% +0.77% $43,963 Conservative Carmine Pontillo 7,108 16.22% -1.22% $45,991 Bloc Québécois Éric Taillefer 6,962 15.89% -4.45% $7,443 New Democrat Peter Deslauriers 6,641 15.16% +3.34% $50,302 Green Jessica Gal 3,378 7.71% +1.74% $959 Marxist–Leninist Rachel Hoffman 177 0.40% +0.14% Total valid votes/Expense limit 43,820 100.00% $83,411 Total rejected ballots 396 0.90% Turnout 44,216 Liberal hold Swing +1.0% Canadian federal election, 2006 Party Candidate Votes % ±% Expenditures Liberal Marlene Jennings 20,235 43.85% -9.35% $64,145 Bloc Québécois Alexandre Lambert 9,385 20.34% -1.65% $15,822 Conservative Allen F. MacKenzie 8,048 17.44% +7.22% $29,196 New Democrat Peter Deslauriers 5,455 11.82% +3.89% $19,445 Green Pierre-Albert Sévigny 2,754 5.97% +0.97% $1,065 Libertarian Earl Wertheimer 152 0.33% -0.04% Marxist–Leninist Rachel Hoffman 118 0.26% +0.06% Total valid votes/Expense limit 46,147 100.00% $78,444 Liberal hold Swing -3.85% Canadian federal election, 2004 Party Candidate Votes % ±% Expenditures Liberal Marlene Jennings 23,552 53.20% -7.53% $63,389 Bloc Québécois Jean-Philippe Chartre 9,736 21.99% +3.88% $9,950 Conservative William R McCullock 4,526 10.22% -1.30% $19,959 New Democrat Maria Pia Chávez 3,513 7.93% +3.20% $6,040 Green Jessica Gal 2,214 5.00% +2.79% $1,069 Marijuana Jay Dell 479 1.08% -0.84% Libertarian Earl Wertheimer 165 0.37% Marxist–Leninist Rachel Hoffman 88 0.20% -0.14% Total valid votes/Expense limit 44,273 100.00% $78,500 Note: Conservative vote is compared to the total of the Canadian Alliance vote and Progressive Conservative vote in 2000 election.
Canadian federal election, 2000 Party Candidate Votes % ±% Liberal Marlene Jennings 28,328 60.72% +4.17% Bloc Québécois Jeannine Ouellet 8,449 18.11% +1.29% Progressive Conservative Kathy Megyery 3,352 7.19% -12.60% New Democrat Bruce Toombs 2,208 4.73% +0.31% Canadian Alliance Darrin Etcovitch 2,022 4.33% Green Katie Graham 1,031 2.21% Marijuana Grégoire Faber 897 1.92% Natural Law Michael Wilson 205 0.44% -0.65% Marxist–Leninist Rachel Hoffman 159 0.34% Total valid votes 46,651 100.00% Note: Canadian Alliance vote is compared to the Reform vote in 1997 election.
Canadian federal election, 1997 Party Candidate Votes % Liberal Marlene Jennings 29,582 56.56% Progressive Conservative John V. Hachey 10,350 19.79% Bloc Québécois Geneviève Dumont-Frenette 8,797 16.82% New Democrat André Cardinal 2,315 4.43% Natural Law Ronald Bessette 569 1.09% Independent Bryan Wolofsky 389 0.74% Independent Caroline Polcsak 303 0.58% Total valid votes 52,305 100.00% References
- ^ "Devenue aveugle, la députée Jennings défend son poste". Rue Frontenac (Montreal), April 28, 2011.
External links
- Official website
- Official Youtube Channel
- Official Twitter Site
- Facebook Page
- Marlene Jennings - Parliament of Canada biography

This article about a Quebec Member of Parliament from the Liberal Party of Canada is a stub. You can help Wikipedia by expanding it.