- Outlier
-
This article is about the statistical term. For other uses, see Outlier (disambiguation).
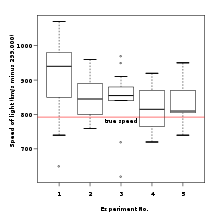 Figure 1. Box plot of data from the Michelson-Morley Experiment displaying outliers in the middle column.
In statistics, an outlier[1] is an observation that is numerically distant from the rest of the data. Grubbs[2] defined an outlier as:
An outlying observation, or outlier, is one that appears to deviate markedly from other members of the sample in which it occurs.
Outliers can occur by chance in any distribution, but they are often indicative either of measurement error or that the population has a heavy-tailed distribution. In the former case one wishes to discard them or use statistics that are robust to outliers, while in the latter case they indicate that the distribution has high kurtosis and that one should be very cautious in using tools or intuitions that assume a normal distribution. A frequent cause of outliers is a mixture of two distributions, which may be two distinct sub-populations, or may indicate 'correct trial' versus 'measurement error'; this is modeled by a mixture model.
In most larger samplings of data, some data points will be further away from the sample mean than what is deemed reasonable. This can be due to incidental systematic error or flaws in the theory that generated an assumed family of probability distributions, or it may be that some observations are far from the center of the data. Outlier points can therefore indicate faulty data, erroneous procedures, or areas where a certain theory might not be valid. However, in large samples, a small number of outliers is to be expected (and not due to any anomalous condition).
Outliers, being the most extreme observations, may include the sample maximum or sample minimum, or both, depending on whether they are extremely high or low. However, the sample maximum and minimum are not always outliers because they may not be unusually far from other observations.
Naive interpretation of statistics derived from data sets that include outliers may be misleading. For example, if one is calculating the average temperature of 10 objects in a room, and most are between 20 and 25 degrees Celsius, but an oven is at 175 °C, the median of the data may be 23 °C but the mean temperature will be between 35.5 and 40 °C. In this case, the median better reflects the temperature of a randomly sampled object than the mean; however, naively interpreting the mean as "a typical sample", equivalent to the median, is incorrect. As illustrated in this case, outliers may be indicative of data points that belong to a different population than the rest of the sample set.
Estimators capable of coping with outliers are said to be robust: the median is a robust statistic, while the mean is not.
Contents
Occurrence and causes
In the case of normally distributed data, roughly 1 in 22 observations will differ by twice the standard deviation or more from the mean, and 1 in 370 will deviate by three times the standard deviation; see three sigma rule[3] for details. In a sample of 1000 observations, the presence of up to five observations deviating from the mean by more than three times the standard deviation is within the range of what can be expected, being less than twice the expected number and hence within 1 standard deviation of the expected number – see Poisson distribution, and not indicative of an anomaly. If the sample size is only 100, however, just three such outliers are already reason for concern, being more than 11 times the expected number.
In general, if the nature of the population distribution is known a priori, it is possible to test if the number of outliers deviate significantly from what can be expected: for a given cutoff (so samples fall beyond the cutoff with probability p) of a given distribution, the number of outliers will follow a binomial distribution with parameter p, which can generally be well-approximated by the Poisson distribution with λ = pn. Thus if one takes a normal distribution with cutoff 3 standard deviations from the mean, p is approximately .3%, and thus for 1,000 trials one can approximate the number of samples whose deviation exceeds 3 sigmas by a Poisson distribution with λ = 3.
Causes
Outliers can have many anomalous causes. A physical apparatus for taking measurements may have suffered a transient malfunction. There may have been an error in data transmission or transcription. Outliers arise due to changes in system behaviour, fraudulent behaviour, human error, instrument error or simply through natural deviations in populations. A sample may have been contaminated with elements from outside the population being examined. Alternatively, an outlier could be the result of a flaw in the assumed theory, calling for further investigation by the researcher. Additionally, the pathological appearance of outliers of a certain form appears in a variety of datasets, indicating that the causative mechanism for the data might differ at the extreme end (King effect).
Caution
Unless it can be ascertained that the deviation is not significant, it is ill-advised to ignore the presence of outliers. Outliers that cannot be readily explained demand special attention – see kurtosis risk and black swan theory.
Identifying outliers
There is no rigid mathematical definition of what constitutes an outlier; determining whether or not an observation is an outlier is ultimately a subjective exercise.
Outlier detection[4] has been used for centuries to detect and, where appropriate, remove anomalous observations from data. Outlier detection can identify system faults and fraud before they escalate with potentially catastrophic consequences. The original outlier detection methods were arbitrary but now, principled and systematic techniques are used, drawn from the full gamut of computer science and statistics.
There are three fundamental approaches to the problem of outlier detection:
- Type 1 - Determine the outliers with no prior knowledge of the data. This is essentially a learning approach analogous to unsupervised clustering. The approach processes the data as a static distribution, pinpoints the most remote points, and flags them as potential outliers.
- Type 2 - Model both normality and abnormality. This approach is analogous to supervised classification and requires pre-labeled data, tagged as normal or abnormal.
- Type 3 - Model only normality (or in a few cases model abnormality). This is analogous to a semi-supervised recognition or detection task. It may be considered semi-supervised as the normal class is taught but the algorithm learns to recognize abnormality.
Model-based methods which are commonly used for identification assume that the data are from a normal distribution, and identify observations which are deemed "unlikely" based on mean and standard deviation:
It is proposed to determine in a series of m observations the limit of error, beyond which all observations involving so great an error may be rejected, provided there are as many as n such observations. The principle upon which it is proposed to solve this problem is, that the proposed observations should be rejected when the probability of the system of errors obtained by retaining them is less than that of the system of errors obtained by their rejection multiplied by the probability of making so many, and no more, abnormal observations. (Quoted in the editorial note on page 516 to Peirce (1982 edition) from A Manual of Astronomy 2:558 by Chauvenet.)
- Dixon's Q test
- ASTM E178 Standard Practice for Dealing With Outlying Observations
Other methods flag observations based on measures such as the interquartile range. For example, if Q1 and Q3 are the lower and upper quartiles respectively, then one could define an outlier to be any observation outside the range:
for some constant k.
Other approaches are distance-based[9][10] and frequently use the distance to the k-nearest neighbors to label observations as outliers or non-outliers.
Working with outliers
The choice of how to deal with an outlier should depend on the cause.
Retention
Even when a normal distribution model is appropriate to the data being analyzed, outliers are expected for large sample sizes and should not automatically be discarded if that is the case. The application should use a classification algorithm that is robust to outliers to model data with naturally occurring outlier points.
Exclusion
Deletion of outlier data is a controversial practice frowned on by many scientists and science instructors; while mathematical criteria provide an objective and quantitative method for data rejection, they do not make the practice more scientifically or methodologically sound, especially in small sets or where a normal distribution cannot be assumed. Rejection of outliers is more acceptable in areas of practice where the underlying model of the process being measured and the usual distribution of measurement error are confidently known. An outlier resulting from an instrument reading error may be excluded but it is desirable that the reading is at least verified.
In regression problems, an alternative approach may be to only exclude points which exhibit a large degree of influence on the parameters, using a measure such as Cook's distance.[11]
If a data point (or points) is excluded from the data analysis, this should be clearly stated on any subsequent report.
Non-normal distributions
The possibility should be considered that the underlying distribution of the data is not approximately normal, having "fat tails". For instance, when sampling from a Cauchy distribution,[12] the sample variance increases with the sample size, the sample mean fails to converge as the sample size increases, and outliers are expected at far larger rates than for a normal distribution.
Alternative models
In cases where the cause of the outliers is known, it may be possible to incorporate this effect into the model structure, for example by using a hierarchical Bayes model or a mixture model.[13][14]
See also
- Anomaly detection
- Anomaly time series
- Robust statistics
- Robust regression
- Box plot
- King effect
- Studentized residual
- Winsorising
- Data transformation (statistics)
References
- ^ Barnett, V. and Lewis, T.: 1994, Outliers in Statistical Data. John Wiley & Sons., 3rd edition.
- ^ Grubbs, F. E.: 1969, Procedures for detecting outlying observations in samples. Technometrics 11, 1–21.
- ^ Ruan, D., Chen, G., Kerre, E.E. and Wets G.(Eds.): Intelligent Data Mining: Techniques and Applications. Studies in Computational Intelligence Vol. 5 Springer 2005, ISBN 978-3-540-26256-5 (page 318)
- ^ Rousseeuw, P. and Leroy, A.: 1996, Robust Regression and Outlier Detection. John Wiley & Sons., 3rd edition.
- ^ Benjamin Peirce, "Criterion for the Rejection of Doubtful Observations", Astronomical Journal II 45 (1852) and Errata to the original paper.
- ^ Peirce, Benjamin (May 1877–1878). "On Peirce's criterion". Proceedings of the American Academy of Arts and Sciences 13: 348–351. doi:10.2307/25138498. JSTOR 25138498.
- ^ Peirce, Charles Sanders (1870 [published 1873]). "Appendix No. 21. On the Theory of Errors of Observation". Report of the Superintendent of the United States Coast Survey Showing the Progress of the Survey During the Year 1870: 200–224.. NOAA PDF Eprint (goes to Report p. 200, PDF's p. 215).
- ^ Peirce, Charles Sanders (1982 [1986 copyright]). "On the Theory of Errors of Observation [Appendix 21, according to the editorial note on page 515]". In Kloesel, Christian J. W., et alia. Writings of Charles S. Peirce: A Chronological Edition. Volume 3, 1872-1878. Bloomington, Indiana: Indiana University Press. pp. 140–160. ISBN 0253372011.
- ^ Knorr, E. M. and Ng, R. T.: 1998, Algorithms for Mining Distance-Based Outliers in Large Datasets. In: Proceedings of the VLDB Conference. New York, USA, pp. 392–403
- ^ Ramaswamy, S., Rastogi, R., and Shim, K.: 2000, ‘Efficient Algorithms for Mining Outliers from Large Data Sets’. In: Proceedings of the ACM SIGMOD Conference on Management of Data. Dallas, TX, pp.427–438.
- ^ Cook, R. Dennis (Feb 1977). "Detection of Influential Observations in Linear Regression". Technometrics (American Statistical Association) 19 (1): 15–18.
- ^ Weisstein, Eric W. Cauchy Distribution. From MathWorld--A Wolfram Web Resource
- ^ Roberts, S. and Tarassenko, L.: 1995, A probabilistic resource allocating network for novelty detection. Neural Computation 6, 270–284.
- ^ Bishop, C. M. (August 1994). "Novelty detection and Neural Network validation". Proceedings of the IEE Conference on Vision, Image and Signal Processing 141 (4): 217–222. doi:10.1049/ip-vis:19941330
- ISO 16269-4, Standard Interpretation of Data, Part 4, Determination of Outliers
- Strutz, Tilo (2010). Data Fitting and Uncertainty - A practical introduction to weighted least squares and beyond. Vieweg+Teubner. ISBN 978-3-8348-1022-9.
External links
- Renze, John, "Outlier" from MathWorld.
- Balakrishnan, N.; Childs, A. (2001), "Outlier", in Hazewinkel, Michiel, Encyclopaedia of Mathematics, Springer, ISBN 978-1556080104, http://eom.springer.de/O/o110080.htm
- Grubbs test described by NIST manual
- how to detect univariate outliers, how to detect multivariate outliers and how to deal with outliers
Categories:- Statistical charts and diagrams
- Statistical terminology
- Data analysis
- Robust statistics
- Statistical outliers

![\big[ Q_1 - k (Q_3 - Q_1 ) , Q_3 + k (Q_3 - Q_1 ) \big]](2/ce20f2f8cd80187942c012f6c0995671.png)
Wikimedia Foundation. 2010.