- Belmore, Ohio
Infobox Settlement
official_name = Belmore, Ohio
settlement_type = Village
nickname =
motto =
imagesize =
image_caption =
image_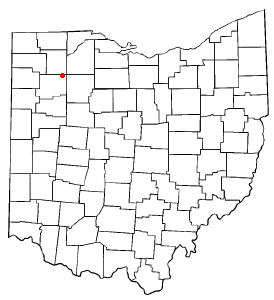
mapsize = 250x200px
map_caption = Location of Belmore, Ohio
mapsize1 =
map_caption1 =subdivision_type = Country
subdivision_name =United States
subdivision_type1 = State
subdivision_name1 =Ohio
subdivision_type2 = County
subdivision_name2 = Putnamgovernment_footnotes =
government_type =
leader_title =
leader_name =
leader_title1 =
leader_name1 =
established_title =
established_date =unit_pref = Imperial
area_footnotes =area_magnitude =
area_total_km2 = 1.1
area_land_km2 = 1.1
area_water_km2 = 0.0
area_total_sq_mi = 0.4
area_land_sq_mi = 0.4
area_water_sq_mi = 0.0population_as_of = 2000
population_footnotes =
population_total = 171
population_density_km2 = 155.0
population_density_sq_mi = 401.4timezone = Eastern (EST)
utc_offset = -5
timezone_DST = EDT
utc_offset_DST = -4
elevation_footnotes = GR|3
elevation_m = 224
elevation_ft = 735
latd = 41 |latm = 9 |lats = 15 |latNS = N
longd = 83 |longm = 56 |longs = 28 |longEW = Wpostal_code_type =
ZIP code
postal_code = 45815
area_code = 419
blank_name = FIPS code
blank_info = 39-05396GR|2
blank1_name = GNIS feature ID
blank1_info = 1064411GR|3
website =
footnotes =Belmore is a village in Putnam County,
Ohio ,United States . The population was 171 at the 2000 census.Geography
Belmore is located at coor dms|41|9|15|N|83|56|28|W|city (41.154203, -83.940993)GR|1.
According to the
United States Census Bureau , the village has a total area of 0.4square mile s (1.1km² ), all of it land.History
Founded in 1862 as Montgomeryville, the name was changed to Belmore in 1868. The town peaked near the end of the 19th Century with several businesses and a population of 448 in 1880. By 1910, the population was below 300 and it dropped steadily throughout the first half of the 20th Century. Throughout rest of the 20th Century, the population has fluctuated between 160 and 320.
In recent years, the town has had a significant Hispanic population. In 1990, of Belmore's 161 residents, 70 of them were of Hispanic origin. Percentage-wise, this is among the highest in Ohio. [Census Data, 1990.]
Demographics
As of the
census GR|2 of 2000, there were 171 people, 50 households, and 42 families residing in the village. Thepopulation density was 401.4 people per square mile (153.5/km²). There were 56 housing units at an average density of 131.4/sq mi (50.3/km²). The racial makeup of the village was 77.19% White, 0.58% Native American, 0.58% Asian, 21.05% from other races, and 0.58% from two or more races. Hispanic or Latino of any race were 25.73% of the population.There were 50 households out of which 48.0% had children under the age of 18 living with them, 64.0% were married couples living together, 6.0% had a female householder with no husband present, and 16.0% were non-families. 10.0% of all households were made up of individuals and 4.0% had someone living alone who was 65 years of age or older. The average household size was 3.42 and the average family size was 3.62.
In the village the population was spread out with 37.4% under the age of 42, 6.4% from 18 to 24, 28.7% from 25 to 44, 22.8% from 45 to 64, and 4.7% who were 65 years of age or older. The median age was 29 years. For every 100 females there were 83.9 males. For every 100 females age 18 and over, there were 105.8 males.
The median income for a household in the village was $42,500, and the median income for a family was $37,143. Males had a median income of $35,375 versus $30,625 for females. The
per capita income for the village was $12,887. About 28.0% of families and 34.3% of the population were below thepoverty line , including 51.9% of those under the age of eighteen and none of those sixty five or over.References
External links
Wikimedia Foundation. 2010.