- Chartjunk
-
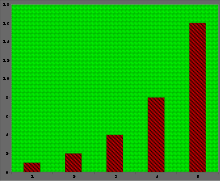 An example of a chart containing gratuitous chartjunk. This chart uses a large area and a lot of "ink" (many symbols and lines) to show only five hard-to-read numbers, 1, 2, 4, 8, and 16.
Chartjunk refers to all visual elements in charts and graphs that are not necessary to comprehend the information represented on the graph, or that distract the viewer from this information.[1][2]
Markings and visual elements can be called chartjunk if they are not part of the minimum set of visuals necessary to communicate the information understandably. Examples of unnecessary elements which might be called chartjunk include heavy or dark grid lines, unnecessary text or inappropriately complex fontfaces, ornamented chart axes and display frames, pictures or icons within data graphs, ornamental shading and unnecessary dimensions.
Another kind of chartjunk skews the depiction and makes it difficult to understand the real data being displayed. Examples of this type include items depicted out of scale to one another, noisy backgrounds making comparison between elements difficult in a chart or graph, and 3-D simulations in line and bar charts.
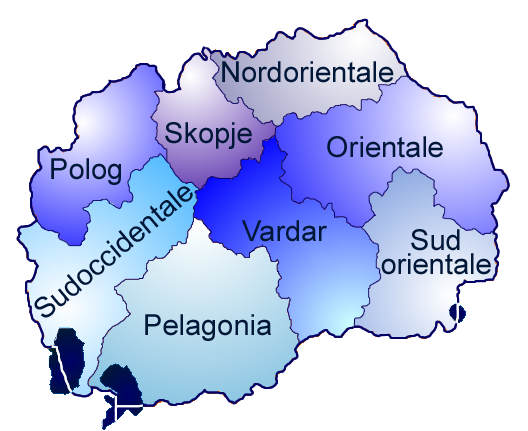
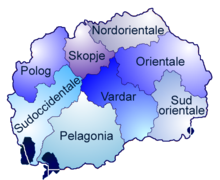 A map with chartjunk: the gradients inside each province.
The term chartjunk was coined by Edward Tufte in his 1983 book The Visual Display of Quantitative Information.[1] Tufte wrote:
The interior decoration of graphics generates a lot of ink that does not tell the viewer anything new. The purpose of decoration varies — to make the graphic appear more scientific and precise, to enliven the display, to give the designer an opportunity to exercise artistic skills. Regardless of its cause, it is all non-data-ink or redundant data-ink, and it is often chartjunk.The term being relatively recent, it is still often associated with Tufte's name.[2][3]
The concept is analogous to Adolf Loos's idea that ornament is a crime.
On the psychological side, it is related to the number of objects an average human can hold in working memory, which is 7 ± 2, according to G.A. Miller (1956).[4] The span of immediate memory and span of absolute judgment imposes severe limitations on the amount of information that humans are able to receive, process and remember[4]; it is necessary to select and focus on key information.
References
- ^ a b Tufte, Edward R. (1983). The Visual Display of Quantitative Information. Cheshire, CT: Graphics Press.
- ^ a b Harris, Robert L. (1999). Information Graphics: A Comprehensive Illustrated Reference. USA: Oxford University Press. p. 72. ISBN 0195135326.
- ^ Cleveland, William S. (1985). The Elements of Graphing Data. Pacific Grove, CA: Wadsworth & Advanced Book Program. p. 25. ISBN 0-534-03730-5.
- ^ a b Miller, G. A. (1956). "The magical number seven, plus or minus two: Some limits on our capacity for processing information". Psychological Review 63 (2): 343–355. http://psychclassics.yorku.ca/Miller/ (pdf)
See also
Categories:- Infographics
- Words coined in the 1980s

Wikimedia Foundation. 2010.