- Nearest-neighbor interpolation
-
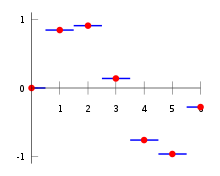 Nearest neighbor interpolation (blue lines) in one dimension on a (uniform) dataset (red points).
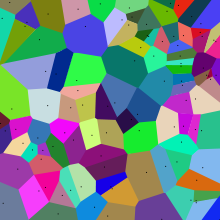 Example of nearest neighbor interpolation of a random set of points (black dots) in 2D. Each coloured cell indicates the area in which all the points have the black point in the cell as their nearest black point.
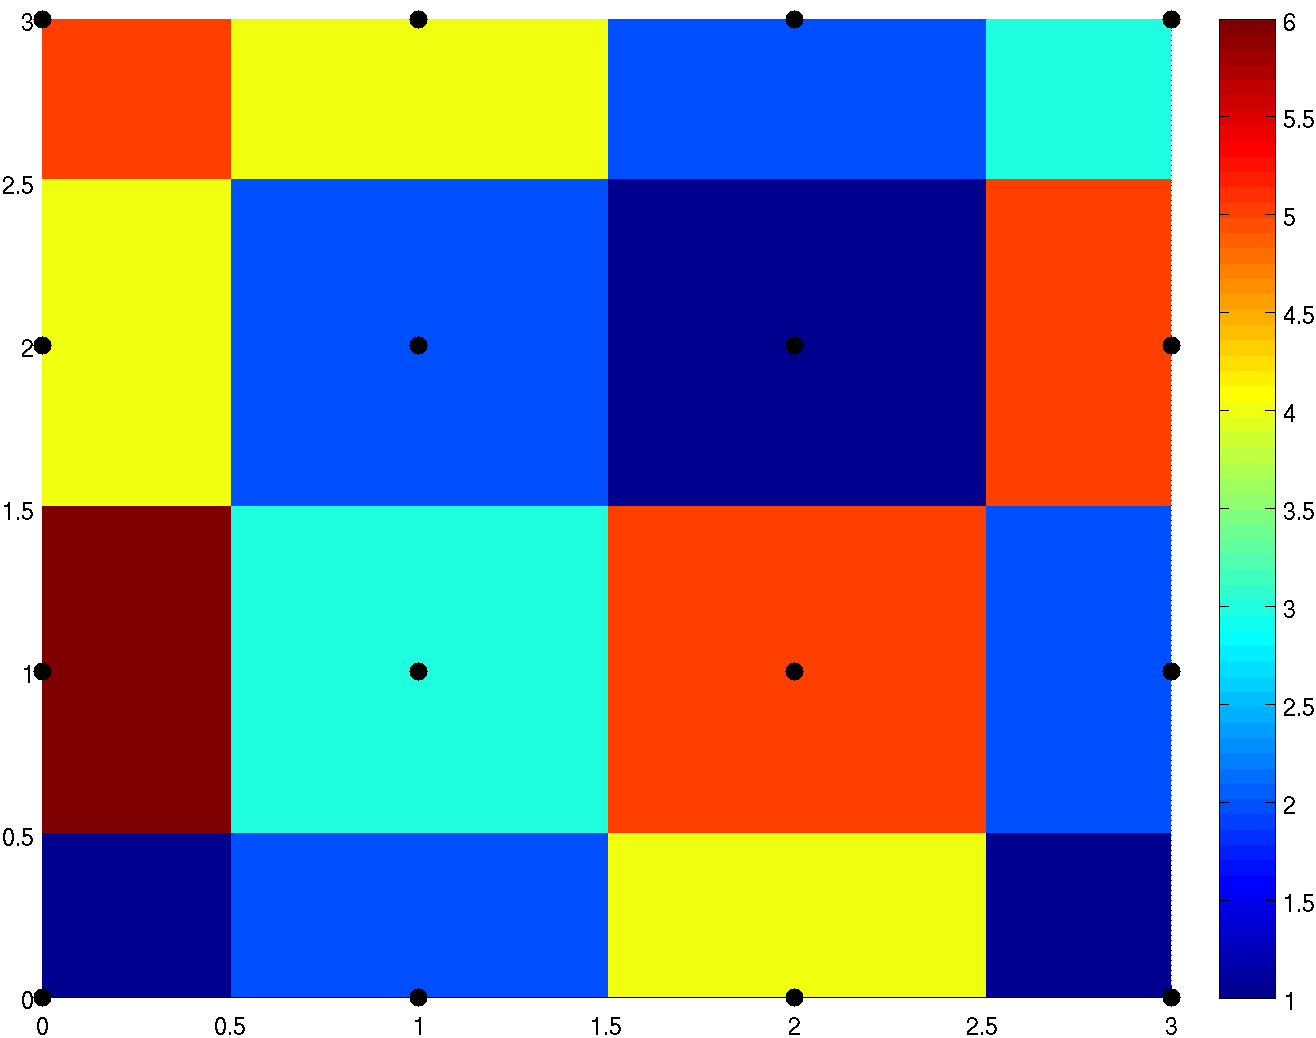
 Nearest neighbor interpolation on a uniform 2D grid (black points).
Nearest-neighbor interpolation (also known as proximal interpolation or, in some contexts, point sampling) is a simple method of multivariate interpolation in one or more dimensions.
Interpolation is the problem of approximating the value for a non-given point in some space when given some colors of points around (neighboring) that point. The nearest neighbor algorithm selects the value of the nearest point and does not consider the values of neighboring points at all, yielding a piecewise-constant interpolant. The algorithm is very simple to implement and is commonly used (usually along with mipmapping) in real-time 3D rendering to select color values for a textured surface.
Connection to Voronoi diagram
For a given set of points in space, a Voronoi diagram is a decomposition of space into cells, one for each given point, so that anywhere in space, the closest given point is inside the cell. This is equivalent to nearest neighbour interpolation, by assigning the function value at the given point to all the points inside the cell. The figures on the right side show by colour the shape of the cells.
See also

This applied mathematics-related article is a stub. You can help Wikipedia by expanding it.