- Dr Kenneth Kaunda District Municipality
-
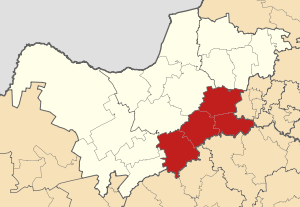 A map of the North West showing Dr Kenneth Kaunda
Dr Kenneth Kaunda District Municipality (formerly Southern District Municipality[1]) is one of the 4 districts of North West province of South Africa. The seat of Kaunda District is Klerksdorp. The majority of its 599 674 people speak Setswana (2001 Census). The district code is DC40. The district was formerly known as the Southern District Municipality.
Contents
Geography
Neighbours
Kaunda District is surrounded (clockwise) by:
- Bojanala Platinum District Municipality to the north
- West Rand District Municipality (Gauteng province) to the east
- Sedibeng District Municipality (Gauteng province) to the east
- Fezile Dabi District Municipality (Free State province) to the south-east
- Lejweleputswa District Municipality (Free State province) to the south
- Dr Ruth Segomotsi Mompati District Municipality to the south-west
- Ngaka Modiri Molema District Municipality to the north-west
Local municipalities
The district contains the following local municipalities:
Local municipality Population % Matlosana 359 198 59.90% Tlokwe 128 356 21.40% Maquassi Hills 69 042 11.51% Ventersdorp 43 081 7.18% Demographics
The following statistics are from the 2001 census.
Language Population % Setswana 263 804 43.99% Afrikaans 116 195 19.38% Sesotho 96 849 16.15% IsiXhosa 83 861 13.98% English 12 921 2.15% IsiZulu 9 430 1.57% Xitsonga 6 642 1.11% Sepedi 3 162 0.53% SiSwati 2 568 0.43% Other 2 458 0.41% IsiNdebele 1 041 0.17% Tshivenda 746 0.12% Gender
Genders Population % Male 301 391 50.26% Female 298 283 49.74% Ethnic group
Ethnic group Population % Black African 472 237 78.75% White 104 375 17.41% Coloured 21 027 3.51% Indian/Asian 2 035 0.34% Age
Age Population % 000 - 004 52 714 8.79% 005 - 009 51 847 8.65% 010 - 014 57 243 9.55% 015 - 019 61 062 10.18% 020 - 024 57 261 9.55% 025 - 029 54 606 9.11% 030 - 034 51 489 8.59% 035 - 039 50 094 8.35% 040 - 044 43 850 7.31% 045 - 049 33 471 5.58% 050 - 054 24 755 4.13% 055 - 059 18 666 3.11% 060 - 064 14 690 2.45% 065 - 069 10 532 1.76% 070 - 074 7 770 1.30% 075 - 079 4 823 0.80% 080 - 084 3 003 0.50% 085 - 089 1 166 0.19% 090 - 094 420 0.07% 095 - 099 150 0.03% 100 plus 62 0.01% Politics
Election results
Election results for Kaunda District in the South African general election, 2004.
- Population 18 and over: 401 692 [66.99% of total population]
- Total votes: 226 396 [37.75% of total population]
- Voting % estimate: 56.36% votes as a % of population 18 and over
Party Votes % African National Congress 174 328 77.00% Democratic Alliance 28 838 12.74% Freedom Front Plus 6 465 2.86% African Christian Democratic Party 3 503 1.55% Independent Democrats 2 877 1.27% Pan African Congress 2 338 1.03% United Democratic Movement 2 095 0.93% New National Party 1 858 0.82% United Christian Democratic Party 1 670 0.74% Inkhata Freedom Party 851 0.38% Azanian People's Organisation 410 0.18% NA 247 0.11% SOPA 171 0.08% CDP 159 0.07% EMSA 141 0.06% UF 116 0.05% PJC 105 0.05% TOP 82 0.04% KISS 54 0.02% NLP 54 0.02% Minority Front 34 0.02% Total 226 396 100.00% References
- Municipal Demarcation Board
- Stats SA Census 2001 page
- Independent Electoral Commission 2004 election results
- Klerksdorper.com The Number One Internet Site for Klerksdorp
- Dr. Kenneth Kaunda District Municipality website
- ^ "New Municipal Names". Municipal Demarcation Board. http://www.demarcation.org.za/Contacts/new_munic_names.aspx. Retrieved 2009-03-08.
Coordinates: 26°50′S 26°35′E / 26.833°S 26.583°E
Province of North West, South Africa Provincial Capital: Mafikeng District
and Local
MunicipalitiesDr Kenneth KaundaVentersdorp · Tlokwe · Matlosana · Maquassi HillsCategories:- District Municipalities of North West (South African province)

Wikimedia Foundation. 2010.