- Relative Strength Index
-
The Relative Strength Index (RSI) is a technical indicator used in the technical analysis of financial markets. It is intended to chart the current and historical strength or weakness of a stock or market based on the closing prices of a recent trading period. The indicator should not be confused with relative strength.
The RSI is classified as a momentum oscillator, measuring the velocity and magnitude of directional price movements. Momentum is the rate of the rise or fall in price. The RSI computes momentum as the ratio of higher closes to lower closes: stocks which have had more or stronger positive changes have a higher RSI than stocks which have had more or stronger negative changes.
The RSI is most typically used on a 14 day timeframe, measured on a scale from 0 to 100, with high and low levels marked at 70 and 30, respectively. Shorter or longer timeframes are used for alternately shorter or longer outlooks. More extreme high and low levels—80 and 20, or 90 and 10—occur less frequently but indicate stronger momentum.
The Relative Strength Index was developed by J. Welles Wilder and published in a 1978 book, New Concepts in Technical Trading Systems, and in Commodities magazine (now Futures magazine) in the June 1978 issue.[1]
Contents
Calculation
For each trading period an upward change U or downward change D is calculated. Up periods are characterized by the close being higher than the previous close:
- U = closenow − closeprevious
- D = 0
Conversely, a down period is characterized by the close being lower than the previous period's (note that D is nonetheless a positive number),
- U = 0
- D = closeprevious − closenow
If the last close is the same as the previous, both U and D are zero. The average U and D are calculated using an n-period exponential moving average (EMA). The ratio of these averages is the Relative Strength:
If the average of D values is zero, then the RSI value is defined as 100.
The Relative Strength is then converted to a Relative Strength Index between 0 and 100:
The exponential moving averages should be appropriately initialized with a simple average using the first n values in the price series.
Interpretation
Basic configuration
 Relative Strength Index 14-period
The RSI is presented on a graph above or below the price chart. The indicator has an upper line, typically at 70, a lower line at 30, and a dashed mid-line at 50. Wilder recommended a smoothing period of 14 (see EMA smoothing, i.e. α = 1/14 or N = 27).
Principles
Wilder posited[1] that when price moves up very rapidly, at some point it is considered overbought. Likewise, when price falls very rapidly, at some point it is considered oversold. In either case, Wilder deemed a reaction or reversal imminent.
The level of the RSI is a measure of the stock's recent trading strength. The slope of the RSI is directly proportional to the velocity of a change in the trend. The distance traveled by the RSI is proportional to the magnitude of the move.
Wilder believed that tops and bottoms are indicated when RSI goes above 70 or drops below 30. Traditionally, RSI readings greater than the 70 level are considered to be in overbought territory, and RSI readings lower than the 30 level are considered to be in oversold territory. In between the 30 and 70 level is considered neutral, with the 50 level a sign of no trend.
Divergence
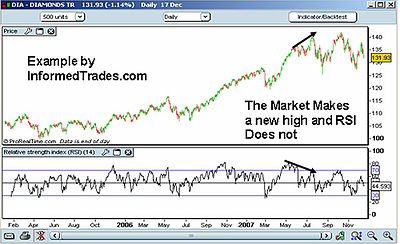
Wilder further believed that divergence between RSI and price action is a very strong indication that a market turning point is imminent. Bearish divergence occurs when price makes a new high but the RSI makes a lower high, thus failing to confirm. Bullish divergence occurs when price makes a new low but RSI makes a higher low.
Overbought and oversold conditions
Wilder thought that "failure swings" above 70 and below 30 on the RSI are strong indications of market reversals. For example, assume the RSI hits 76, pulls back to 72, then rises to 77. If it falls below 72, Wilder would consider this a "failure swing" above 70.
Finally, Wilder wrote that chart formations and areas of support and resistance could sometimes be more easily seen on the RSI chart as opposed to the price chart. The center line for the relative strength index is 50, which is often seen as both the support and resistance line for the indicator.
If the relative strength index is below 50, it generally means that the stock's losses are greater than the gains. When the relative strength index is above 50, it generally means that the gains are greater than the losses.
Uptrends and downtrends
In addition to Wilder's original theories of RSI interpretation, Andrew Cardwell has developed several new interpretations of RSI to help determine and confirm trend. First, Cardwell noticed that uptrends generally traded between RSI 40 and 80, while downtrends usually traded between RSI 60 and 20. Cardwell observed when securities change from uptrend to downtrend and vice versa, the RSI will undergo a "range shift."
 Example of RSI Indicator Divergence
Next, Cardwell noted that bearish divergence: 1) only occurs in uptrends, and 2) mostly only leads to a brief correction instead of a reversal in trend. Therefore bearish divergence is a sign confirming an uptrend. Similarly, bullish divergence is a sign confirming a downtrend.
Reversals
Finally, Cardwell discovered the existence of positive and negative reversals in the RSI. Reversals are the opposite of divergence. For example, a positive reversal occurs when an uptrend price correction results in a higher low compared to the last price correction, while RSI results in a lower low compared to the prior correction. A negative reversal happens when a downtrend rally results in a lower high compared to the last downtrend rally, but RSI makes a higher high compared to the prior rally.
In other words, despite stronger momentum as seen by the higher high or lower low in the RSI, price could not make a higher high or lower low. This is evidence the main trend is about to resume. Cardwell noted that positive reversals only happen in uptrends while negative reversals only occur in downtrends, and therefore their existence confirms the trend.
Cutler's RSI
A variation called Cutler's RSI is based on a simple moving average of U and D,[2] instead of the exponential average above. Cutler had found that since Wilder used an exponential moving average to calculate RSI, the value of Wilder's RSI depended upon where in the data file his calculations started. Cutler termed this Data Length Dependency. Cutler's RSI is not data length dependent, and returns consistent results regardless of the length of, or the starting point within a data file.
Cutler's RSI generally comes out slightly different from the normal Wilder RSI, but the two are similar, since SMA and EMA are also similar.
See also
- MACD moving average convergence/divergence
- True Strength Index, a similar momentum-based indicator
References
- ^ a b J. Welles Wilder, New Concepts in Technical Trading Systems, ISBN 0-89459-027-8
- ^ Cutler's RSI page at Aspen Graphics Technical Analysis Software
External links
Concepts Support and resistance · Trend line · Breakout · Market trend · Dead cat bounce · Elliott wave principle · Fibonacci retracements · Pivot point · Dow theoryCharts Patterns Head and shoulders · Cup and handle · Double top and double bottom · Triple top and triple bottom · Broadening top · Price channels · Wedge pattern · Triangle · Flag and pennant · Island reversal · GapCandlestickSimpleComplexIndicators Average Directional Index (ADX) · Ichimoku Kinkō Hyō · Moving Average Convergence/Divergence (MACD) · Mass Index · Moving average (MA) · Parabolic SAR (SAR) · Smart Money Index (SMI) · Trix · Vortex Indicator (VI) · Know sure thing oscillator (KST)Relative Strength Index (RSI) · Stochastic oscillator · True Strength Index (TSI) · Williams %R (%R)VolumeAccumulation/Distribution Index · Money Flow Index (MFI) · On-balance volume (OBV) · Volume Price Trend (VPT) · Force Index (FI) · Negative volume index (NVI) · Ease of movement · Put/call ratio (PCR)OtherAdvance–decline line (ADL) · Commodity Channel Index (CCI) · Coppock curve · Keltner channel · McClellan oscillator · Ulcer Index · Ultimate oscillatorCategories:- Technical indicators


Wikimedia Foundation. 2010.